Determining the right product assortment in cannabis retail

Introduction
Imagine a cannabis store with thousands of products bulging out of every nook and cranny of every shelf, dangling from the ceiling, and overflowing from bins. Does that sound like a pleasant and easy shopping experience? Now imagine a stark and empty shop with no shelves at all, just one glass case with three products to choose from. Clearly this is also not an optimal customer experience when the landscape of cannabis products is increasingly diverse. Somewhere between these two extreme pictures is the ideal product assortment and shopping experience, but how do you find the right balance for your customers?
Assortment planning can be one of the most challenging aspects of retail, regardless of industry. Retailers often wonder, how many products should I carry? How can I reduce the amount of capital that is tied up in inventory? Which products are the rights ones to have on a shelf?
In this industry report, we'll evaluate essential inventory and assortment metrics across 17 recreational and medical cannabis markets in the US and Canada to get a better understanding of where the industry stands today. We'll also introduce the ABC-XYZ framework, a strategy for data-driven assortment management that can be highly effective in any retail setting. To find out how you can leverage your own store's data to optimize inventory management and product assortment, sign up for a demo of Headset Retailer.
Executive Summary
According to the Pareto Principle, or the 80/20 rule, there is a tendency for 80% of results to come from 20% of the input. We see this phenomenon expressed in cannabis sales, where the majority of sales comes from a fraction of the store's products. In Alberta, for example, 39.4% of top selling products contributed to 80% of sales for the median retailer. In Oklahoma, 26.7% of products contributed to 80% of sales. Exploring further, we find that 21.2% of products at a median retail in Oklahoma did not sell in a 90-day time period. In California, 14.1% of products did not sell, and took up valuable space on store shelves. For these reasons, it is critical to identify the products in your store that are driving the most sales in order to optimize your product assortment.
Methodology
This data is collected directly from Recreational and Medical cannabis retailers in US and Canadian markets* via integrations with point of sale software. All data was collected on April 9th, 2021 and covers the previous 90 days (January 9 - April 9 2021). All metrics reported are from the median store within Headset's sample from the given state or province.
*US and Canadian markets include AB, AZ, BC, CA, CO, FL, IL, MA, MI, MD, NM, PA, OK, ON, OR, SK, & WA.
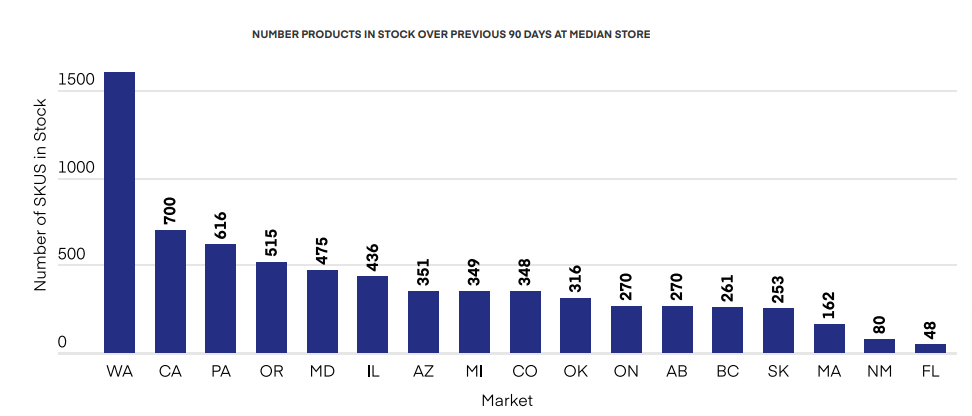
Number of products in stores across markets
Products contributing 80% of total sales

The Pareto Principle, more commonly referred to as the 80/20 rule, describes a tendency where 80% of results come from only 20% of the inputs. Here we see that in the cannabis industry over the previous 90 days, we don’t find an exact 80:20 split, but there is still a majority of sales produced by the best selling minority of products in each distinct cannabis market. At the high end, we can see that in Alberta, the top selling 39.4% of distinct products within the median retailer brought in 80% of total sales over the previous 90 days. Oklahoma stands out on the low end, with just slightly over a quarter of products (the top 26.7% of distinct SKUs) contributing 80% of all sales in the median retailer. To some extent, this type of ratio will be unavoidable as there will always be differences in sales performance between products in your store. However, it is critical to focus on eliminating products that don’t pull their weight towards your revenue goals. On that note, let’s next look at an easy way to trim excess inventory.
Proportion of inventory that is stale by market

Here we see the proportion of products that were in stock, but had zero sales over the previous 90 days. These are products that any retailer should work to identify and improve sales performance, or eliminate from their assortment. Given the values we saw on the last graph, it is not surprising that Oklahoma has the highest value here, with more than 20% of distinct products at the median retailer being stale with no sales, over the previous 90 days. The Canadian markets flex their inventory efficiency muscles again here, all with lower ratios of stale products than most US markets. The median store in British Columbia managed an impressive value of 3.9%, meaning that more than 24 out of 25 of their products logged at least one sale over the previous 90 days. Finding products that haven’t sold recently is easy using the Inventory Coverage dashboard in Headset Retailer Premium. How many stale products are you sitting on?
Managing inventory effectively with ABC-XYZ analysis
Retailers are frequently asking themselves questions such as: am I stocking the right products? How do I focus my inventory planning on the products that drive revenue? How can I reduce my overall inventory carry without compromising the customer’s shopping experience? The ABC-XYZ framework can help retailers answer these questions. The core concept of ABC-XYZ analysis is products are not created equal (e.g., certain products account for disproportionate shares of revenue, this is another example of the Pareto principle), and therefore their inventory should be managed in accordance with their relative value.
ABC-XYZ analysis is very commonplace not only in traditional CPG, but any industry where companies hold physical products in inventory. Not only does ABC-XYZ analysis have applications in various industries, but also in various job functions, ranging from accounting to data science
.If a retailer wanted to apply this framework to their own store’s inventory, they could do so in Headset’s Retailer product via the Inventory Management module, which will be launching May 2021. Within the module, there are dashboards that apply the ABC-XYZ framework to help retailers compare SKUs, categories, brands, and vendors.
What is ABC-XYZ analysis?
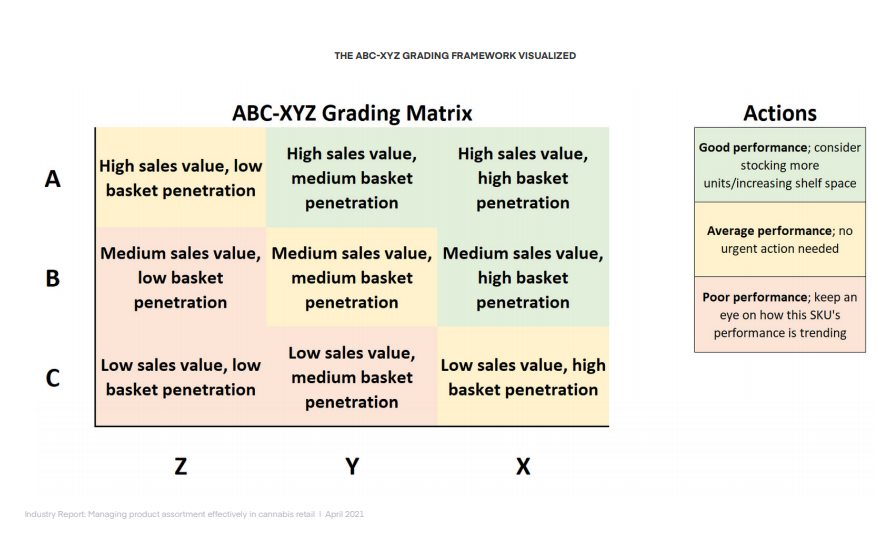
ABC-XYZ analysis is a two-dimensional framework for assigning a grade or relative value to individual products. This allows a retailer to effectively compare products across a wide array of groups, such as category, segment, brand, vendor, package size, etc. Here, we will focus specifically on comparing products on the category level.
The ABC dimension rates products based on their relative contribution of sales within a store’s category. For example, a product in a category’s top 70% of sales would have high sales value (an “A” grade), a product in a category’s 70%-90% of sales would have medium sales value (a “B” grade), and a product in the bottom 10% of a category’s sales, or 90%-100%, would have low sales value (a “C” grade).
While ABC grading is a powerful tool for understanding a product’s value, retailers shouldn’t focus their inventory planning solely on a product’s sales value. If we took ounces of Flower as an example, we know these products have high item prices and therefore would show much larger sales volumes than an eighth product, but ounces are purchased very infrequently compared to eighths. We address this by adding the second dimension, XYZ, into a product’s grading.
The XYZ dimension rates a product based on the frequency it shows up in customer baskets, which is measured by basket penetration (the percent of a given category’s baskets containing the product). For example, a product with a basket penetration rate in the top 30% of the category would have high basket penetration(an “X” grade), a product in the 30th-70th percentile would have medium basket penetration (a “Y” grade), and a product in the 70th-100th percentile would have low basket penetration (a “Z” grade).
When we combine these two dimensions, we arrive at the matrix shown in the image. This matrix provides retailers with the ability to easily understand how important a product is to customers as well as their store’s revenue
What does a “good” store assortment look like under the ABC-XYZ framework?

Using the ABC-XYZ framework for grading SKU performance, retailers are able to review their store’s inventory composition. In this graph, we are viewing the SKU composition of a retailer in British Columbia, which reflects “good” assortment performance.
The most interesting data point here is the sales share vs SKU share ratio of high performing SKUs (those in the AX, AY, and BX buckets), which is +23.8%, indicating these SKUs over perform in sales given their share of shelf space. The large share of SKUs in high graded buckets could enable this retailer to allocate less time to inventory optimization as it is much easier to discern which specific products are helping them drive revenues.
What does a “poor” store assortment look like under the ABC-XYZ framework?

Looking at the SKU grade composition of a store on the low performance end of the spectrum, we see a different story. While in the “good” assortment we saw on the prior slide, there was a positive ratio (+23.8%) of high performing graded SKU share to sales share, in a different BC retailer we see SKUs with AX, AY, or BX grades account for 59.3% of SKUs, but produce only 57.1% of sales (-3.7% SKU share to sales share ratio).
Additionally in this “poor” performing assortment, we see that CX graded SKUs account for over 10% of SKUs and over 25% of sales (+132.4% ratio), suggesting this retailer depends on long-tail products to drive sales. This dynamic makes managing inventory more challenging for a retailer as they must carefully manage many more SKUs in order to ensure they can produce revenue as opposed to having more high performing SKUs where they can focus their inventory management efforts.
Conclusion
In the previous slides, we saw the importance of identifying products in your inventory that are driving the most, and the least, sales. In California, for example, 32.3% of products drive 80% of sales in cannabis stores, and 14.1% of products may not sell at all. Coupling Headset Retailer and the ABC-XYZ framework will help you optimize your product assortment and help create a more ideal shopping experience for your customers. Ready to see how Retailer can help you make data-driven decisions that drive more revenue? Sign up for a demo.
Key Takeaways
• While there is significant variation across markets, the median North American cannabis store stocked about 400 distinct products over the previous 90 days.
• A small number of the best selling products in any given cannabis shop contribute a disproportionate amount of total revenue.
• Depending on the market, up to 20% of a cannabis shop’s total distinct products may be ‘stale’; having zero sales in the previous 90 days
• The ABC-XYZ framework for assortment management is widely utilized across traditional retail and is an extremely effective tool for cannabis retailers to optimize their product assortment.
Using SKU grading analysis, such as ABC-XYZ, enables retailers to focus their assortment and inventory efforts on products driving revenue and growth

Cannabis Market Resources


