Tracking Potency: The Data Behind Cannabis’s Rising THC Levels


Introduction
While the cannabis plant can carry over 100 different cannabinoids, it's the psychoactive cannabinoid THC that everyone associates with the potency of cannabis products. This fixation on potency and THC has gripped the industry, sending cultivators, brands, and retailers into a THC arms race. High-THC products cater to the most frequent consumers, in our industry more than half of monthly sales at retailers come from just 20% of customers, who favor these products. So, in an industry reliant on THC rates to drive sales, which markets have the highest-potency products? How have product attributes changed over time? How does this focus on THC position the industry for future growth?
Methodology
Data for this report come from real-time sales reported by participating cannabis retailers via their point-of-sale systems, which are integrated with Headset's business intelligence platform. Because the data are transmitted digitally and directly from partner retailers, Headset's dataset is highly reliable. Nevertheless, occasional inaccuracies may occur—for example, duplicate transactions, misclassified products, incorrect product entries in point-of-sale systems, or simple human error at checkout—so a small margin of error should be assumed. In addition, not every market provides sufficient data; any markets omitted from the THC analysis were excluded due to insufficient coverage.
THC Potency by Market
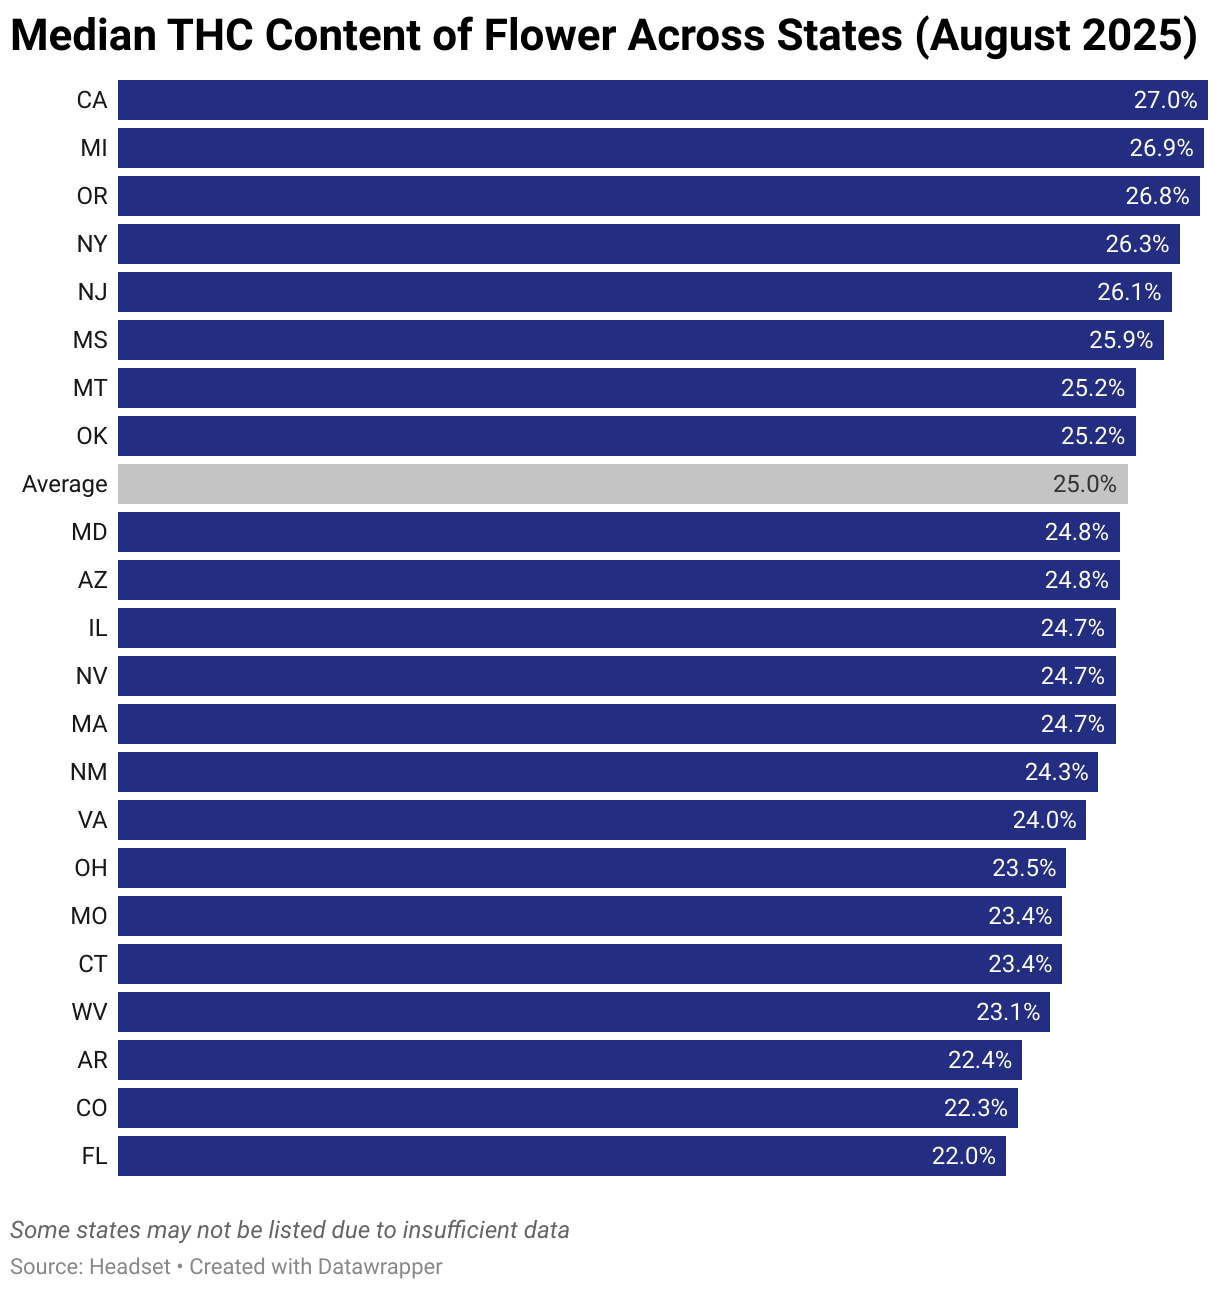
Among tracked markets, California, Michigan, and Oregon stand out for their high-THC Flower, where a typical product is marketed at around 27 percent THC. In contrast, lower-THC markets such as Colorado and Florida average closer to 22 percent. While a five-point gap may not seem significant at first glance, it represents a meaningful difference in how products are positioned and perceived by consumers.
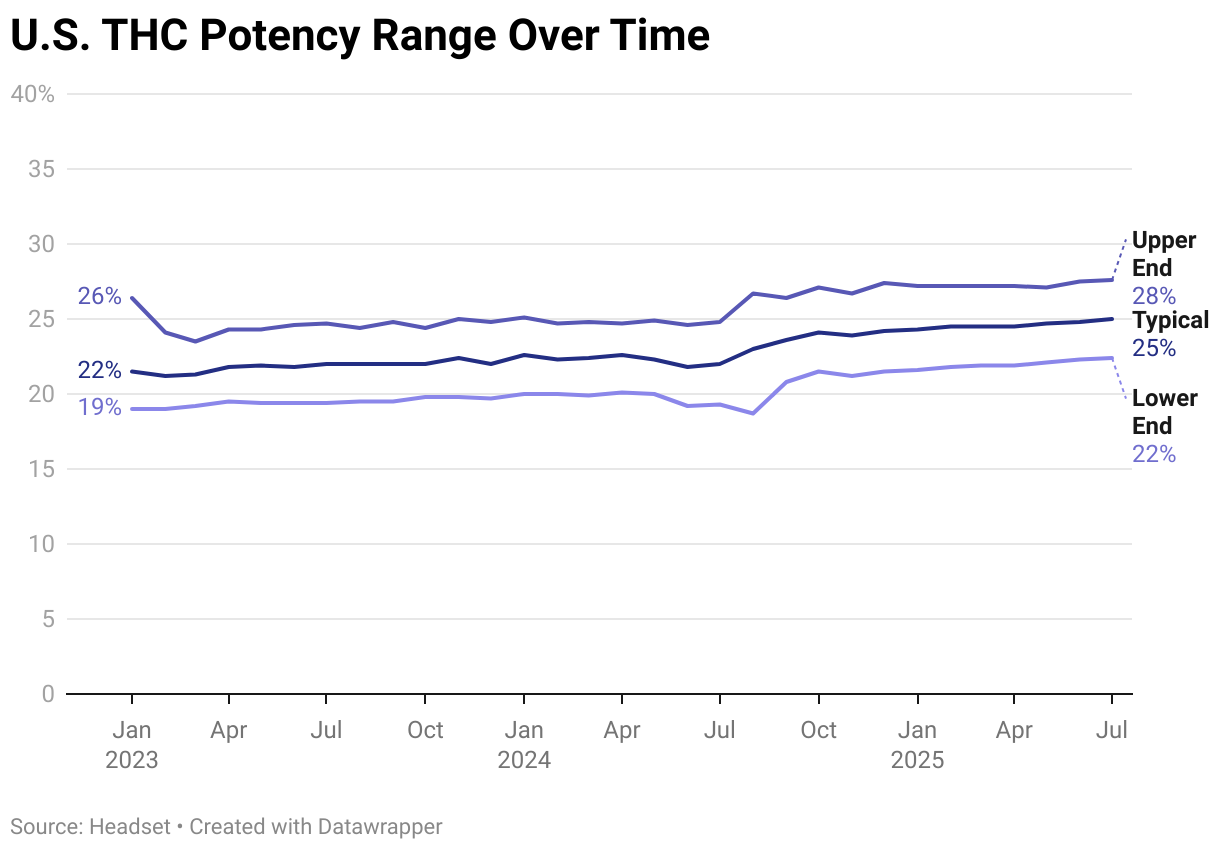
Cannabis potency is often presented as a single number, but it is more accurately described as a range. The lower end, or 25th percentile, represents the lighter side of the market, while the median marks the midpoint where half of products test below and half above. The upper end, or 75th percentile, reflects the stronger side of what is typical. Together, these values form the interquartile range, offering a clearer picture of the potency consumers are most likely to encounter. As of July 2025, THC levels across most U.S. markets generally fall between 22 and 28 percent, with the typical flower product testing at about 25 percent. This range has been trending upward in recent years, though the pace and scale of change vary by market, reflecting differences in consumer demand, cultivation practices, and regulatory environments.
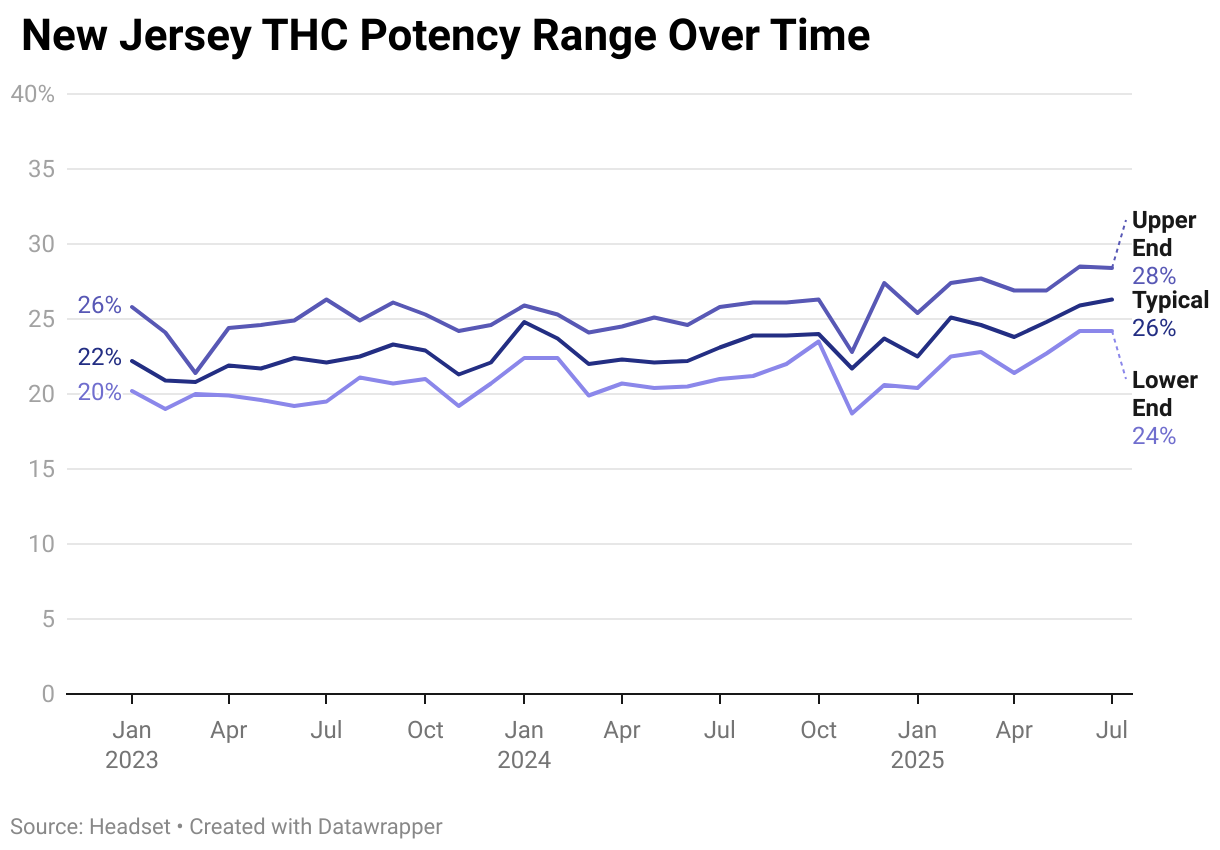
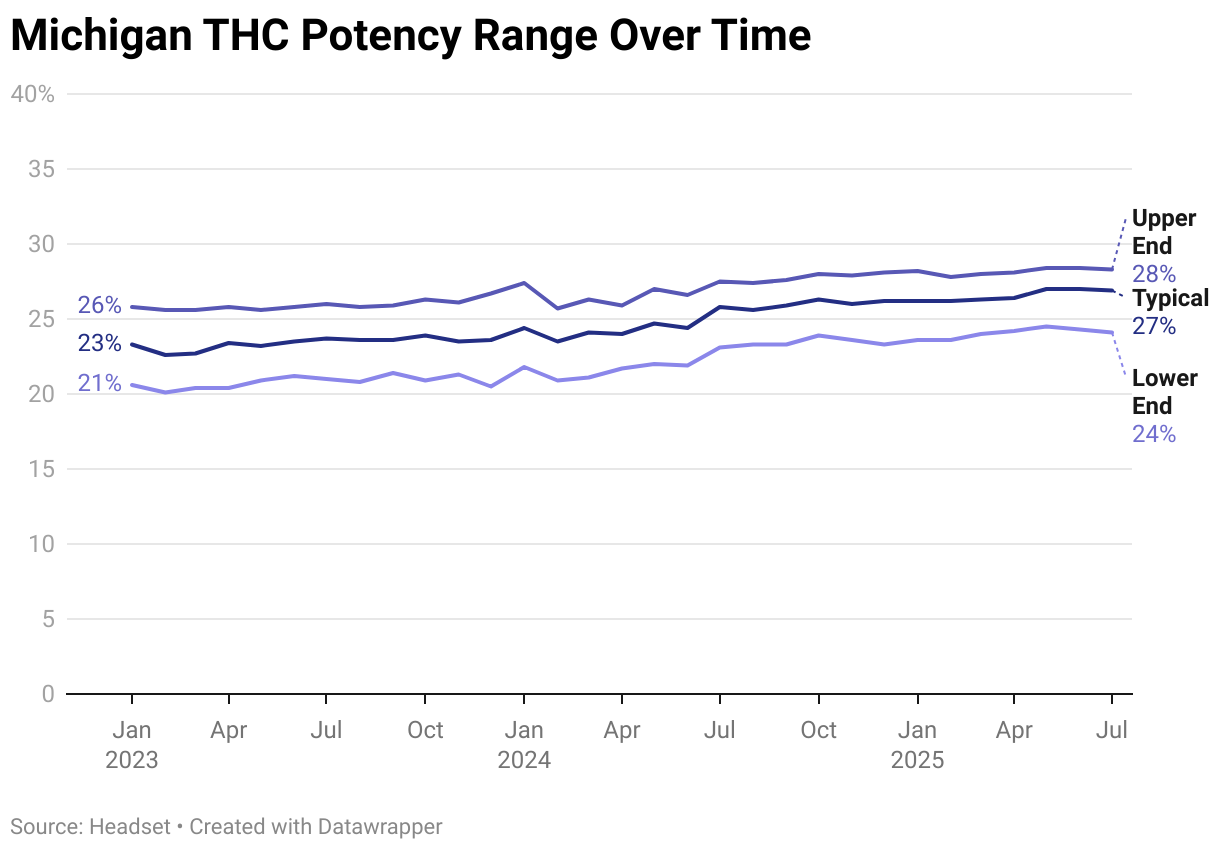
THC levels have generally trended upward, especially in newer markets across emerging regions like the Northeast and Midwest. States such as Michigan, New Jersey, Maryland, Missouri, New York, and Arizona have all shown notable growth in Flower potency.
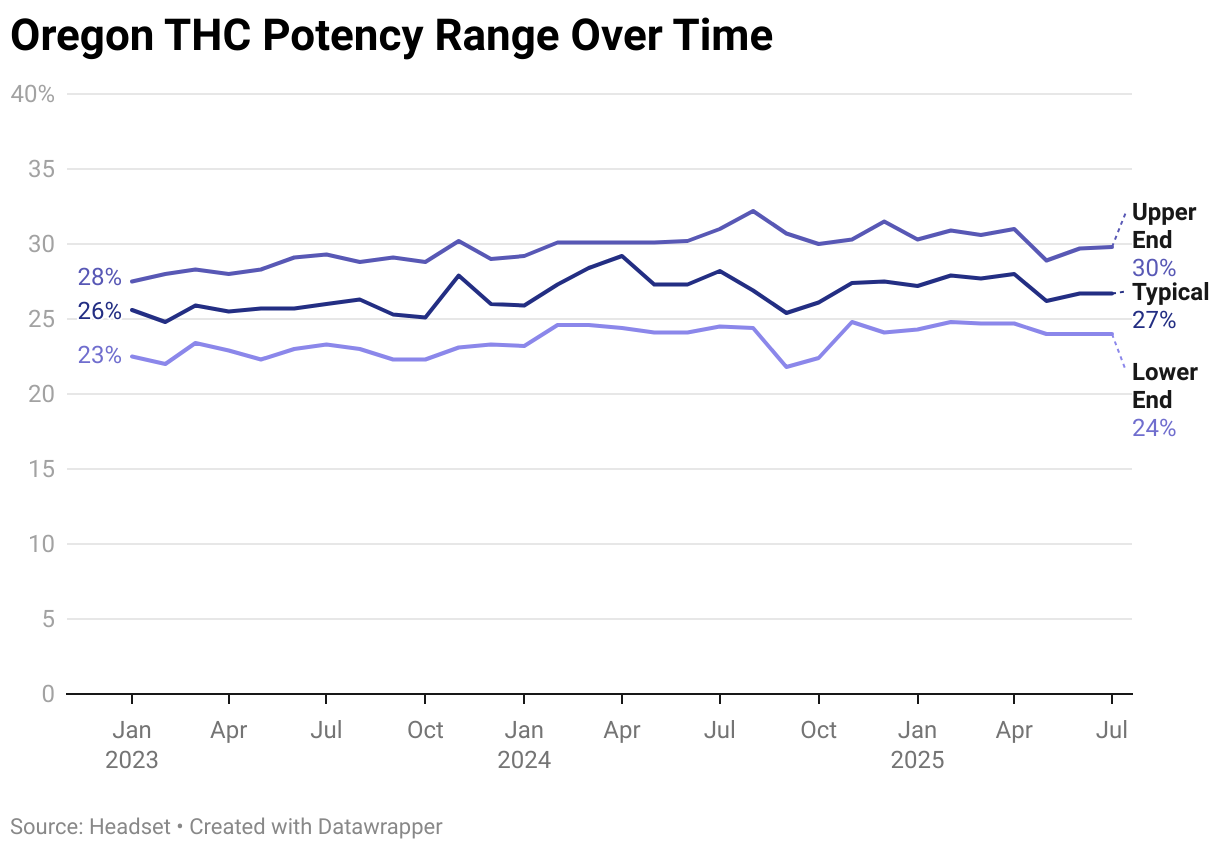
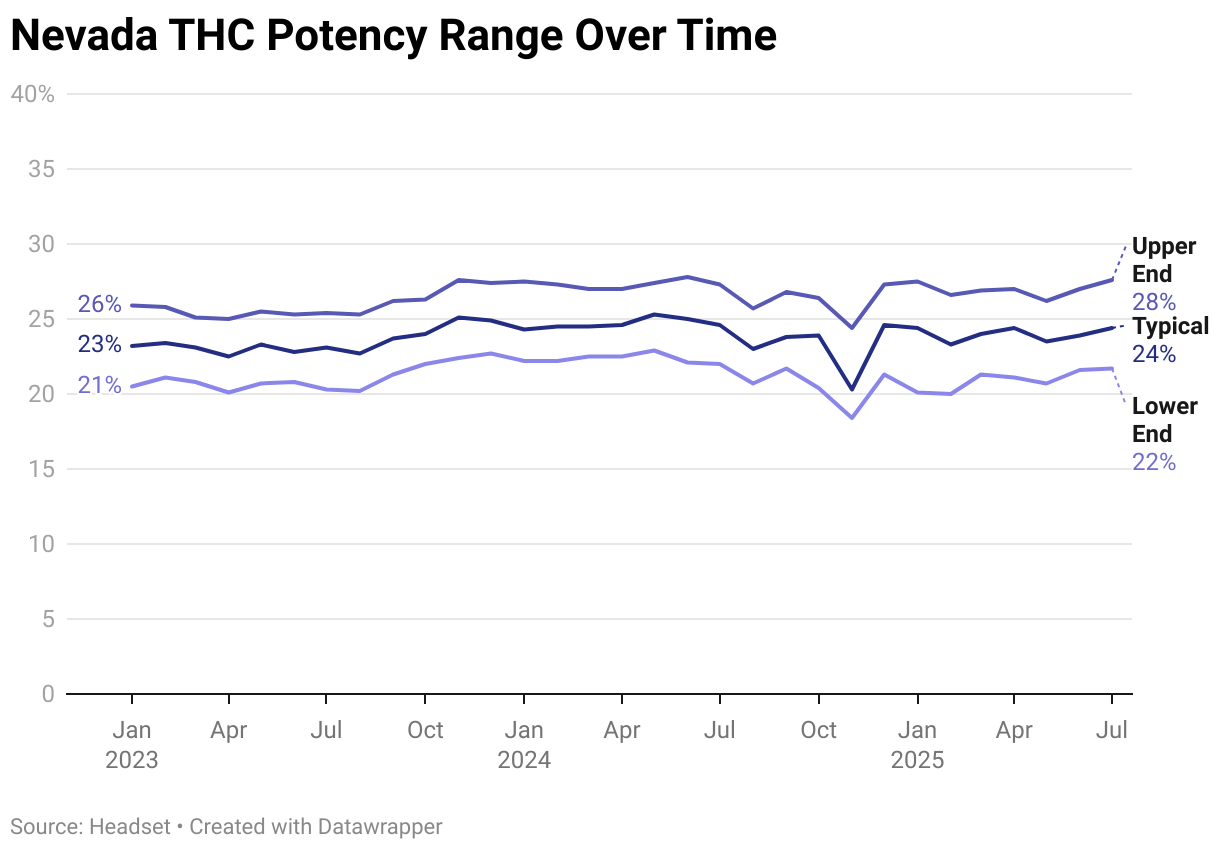
Established markets particularly in western regions such as Oregon, Nevada and Massachusetts showed flat or modest growth in potency between the start of 2023 an July 2025
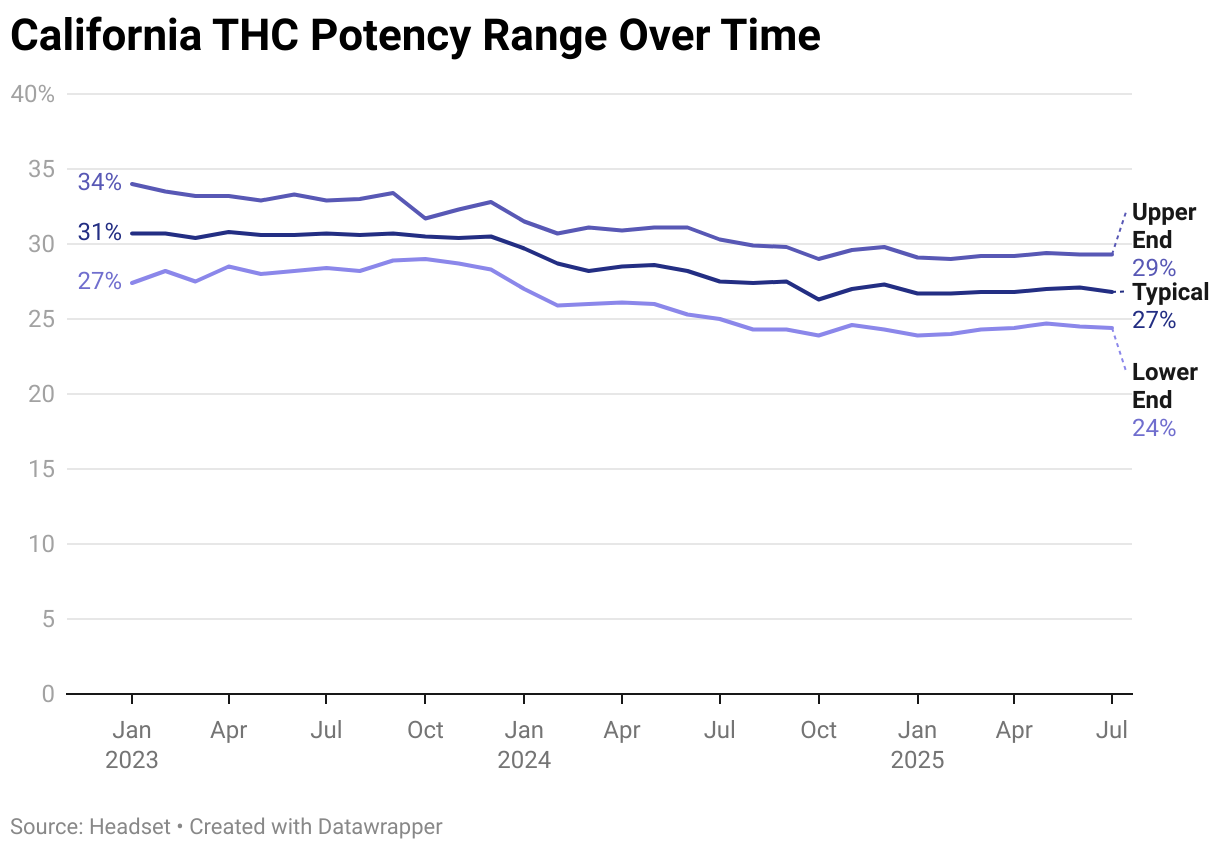
Interestingly, in California, displayed THC levels have declined from 30 percent or higher in January 2023 to around 27 percent by July 2025. This trend may be partly linked to past, and in some cases ongoing issues in California testing labs. Similar anomalies were observed in Massachusetts during 2024, when lawsuits were filed against testing labs accused of inflating THC results.
The Effect of Potency on Sales
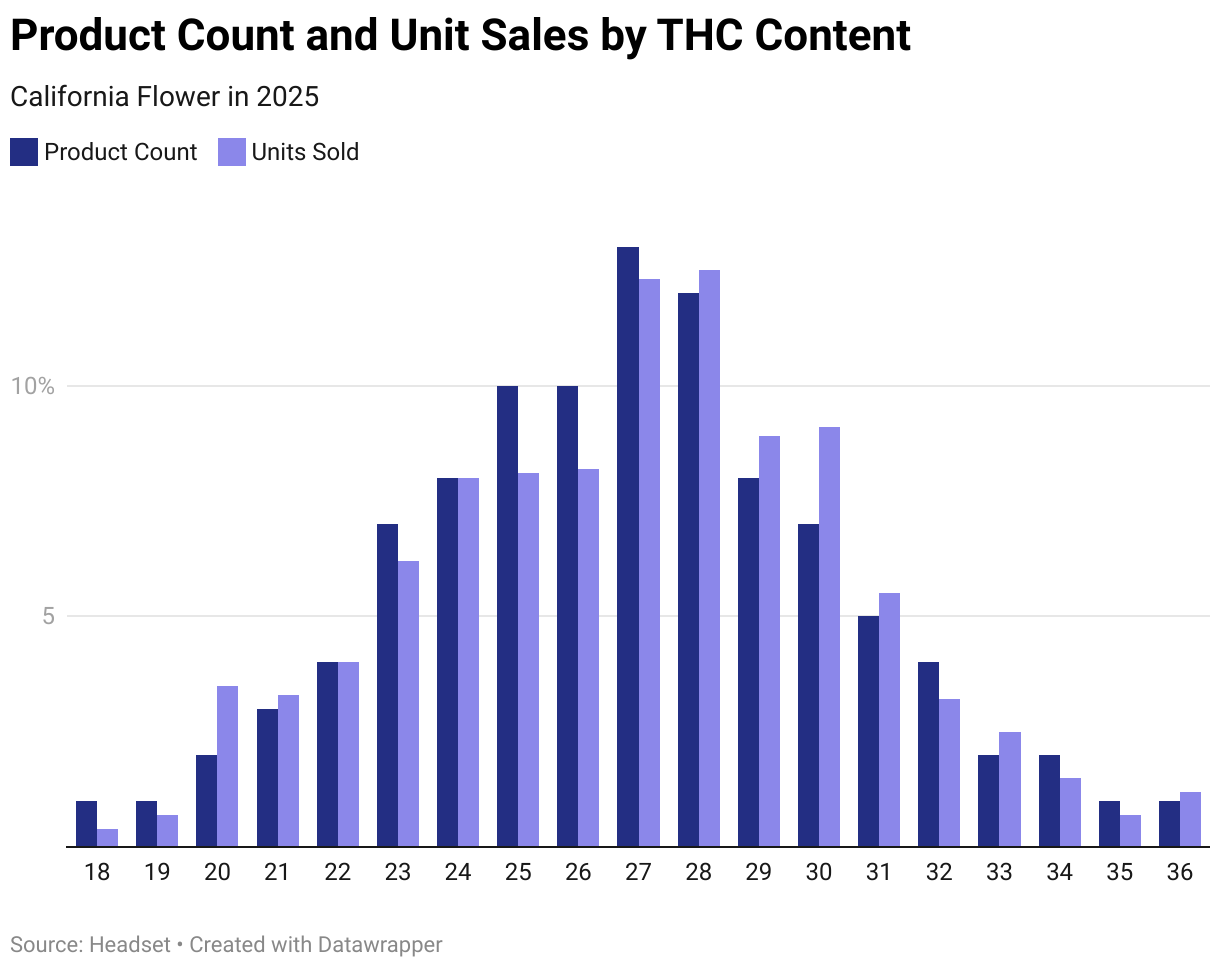
Product potency has a clear impact on sales. In California, Flower products marketed with total THC levels between 25 and 27 percent make up 31.5 percent of total sales. By comparison, 25.6 percent of products are marketed at 28 to 30 percent THC. While there are more than 23 percent more unique Flower products in the lower THC range, the higher-potency group still sells over 6 percent more total units despite having fewer products available.
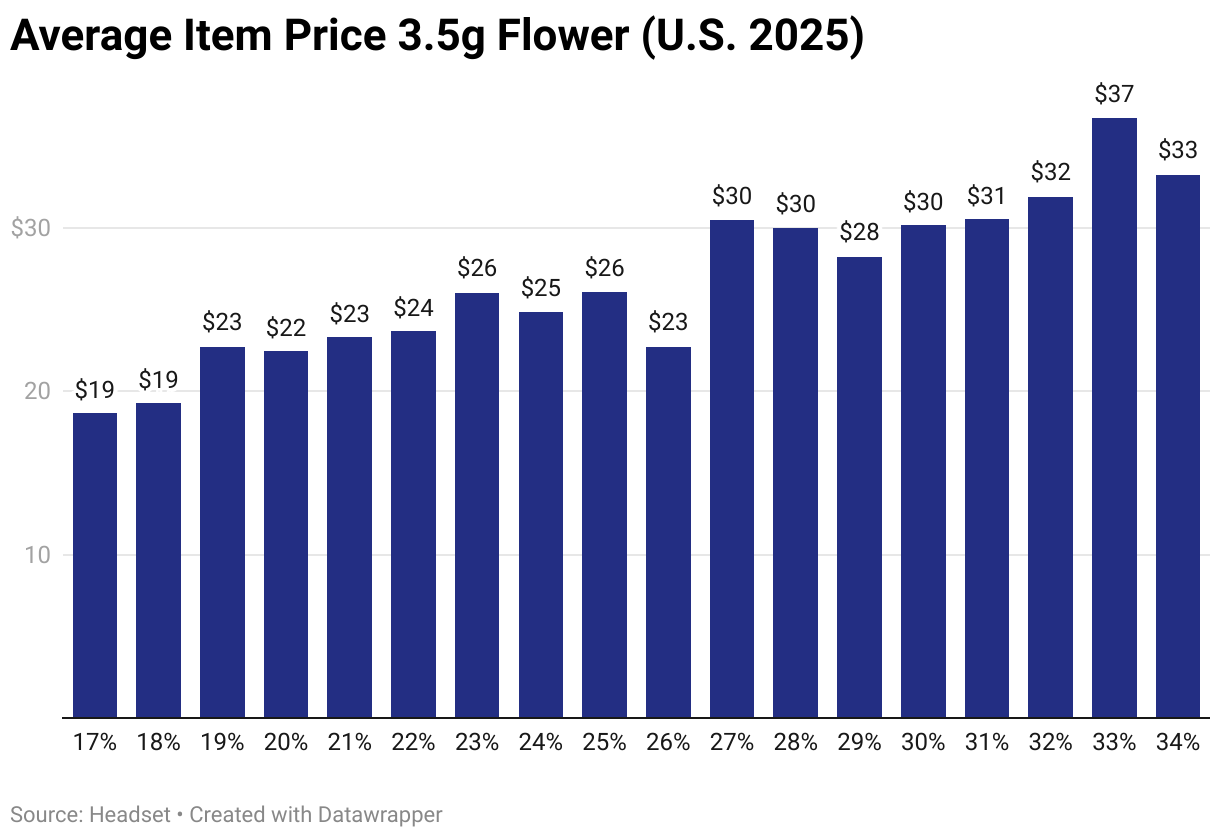
Retailers and brands are not only selling more units of higher-THC products, they are also commanding higher prices for them. While unit volume for high-potency products is 6 percent greater, the total sales value is 12 percent higher compared to products marketed with lower THC levels. Consumers are not just more inclined to choose higher-THC options—they are also willing to pay a premium, with the average price of an eighth of Flower in the higher potency range coming in 8 percent above that of lower-potency products.
Potency Trends within Product Categories
With some sources suggesting a biological ceiling of around 35% THC in cannabis Flower, brands are searching for new ways to deliver additional potency to customers chasing that benchmark. Because higher potency is closely linked to stronger sales, companies are being pushed to innovate products that meet the demand for ever-more powerful offerings.
In mature markets such as Nevada, Oregon, California, and Colorado, growth in average THC levels has slowed compared to emerging markets, evidence that potency can't be expected to rise indefinitely.
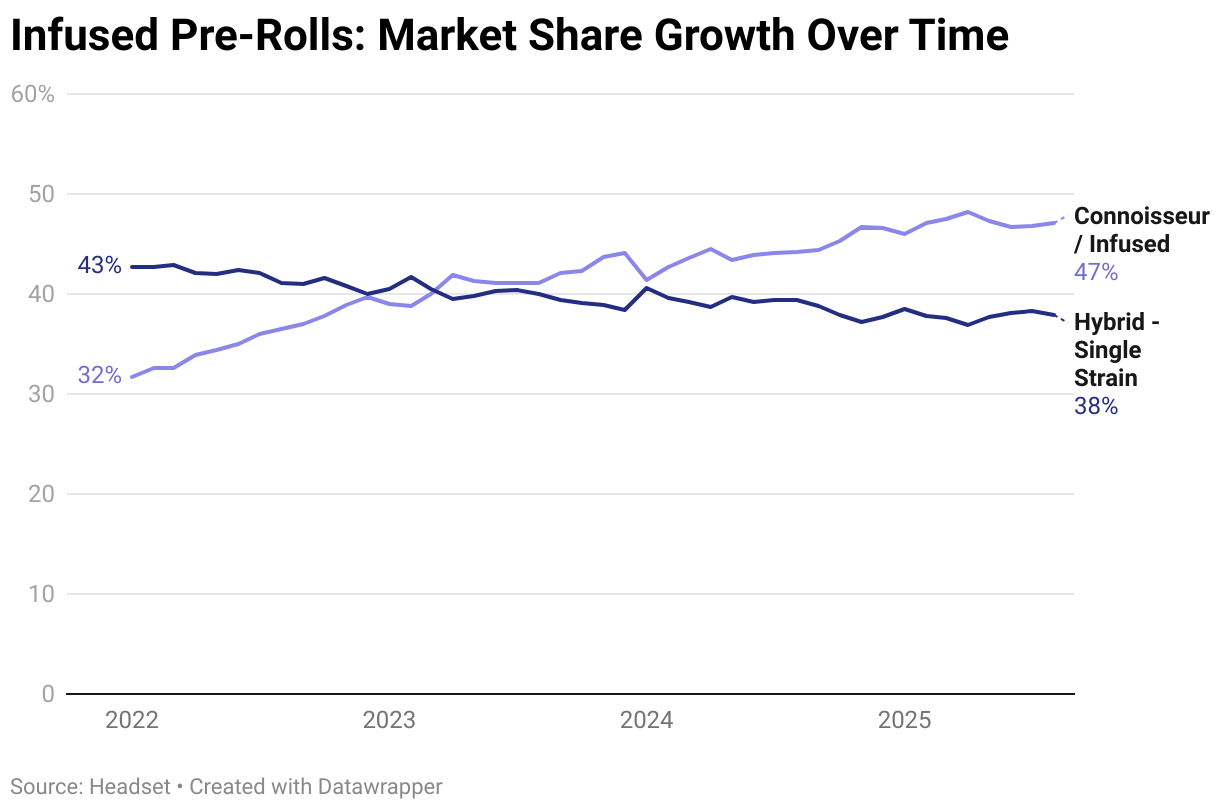
At the same time, growing segments like Connoisseur/Infused pre-rolls and high-dose single-serving beverages highlight how consumer spending continues to flow toward potency-driven products.
Conclusion
Cannabis product potency is at an all-time high, with THC driving much of the growth. The financial incentive for brands and retailers to develop and stock increasingly potent products is clear. In emerging markets, where THC levels still have room to rise, there's a proven blueprint for capturing a core base of loyal shoppers motivated by potency, price, and perceived value.
Across categories, the push toward high-potency products allows brands to attract a small but influential group of top spenders. However, as shelf space and product innovation increasingly prioritize potency, the question arises: what happens to the larger cohort of less experienced "canna-curious" consumers? By focusing so heavily on high-THC products, does the industry risk alienating this group, the very segment that may represents the greatest long-term growth opportunity? Instead, this could lead these consumers to gravitate toward alternative options, such as hemp-derived products, that offer lower-dose formats better suited to new or casual consumers.