Hemp-Derived THC Beverages
The Most Comprehensive Retail Dataset for Hemp THC Beverages
Track distribution, pricing, sales velocity, and competitive positioning across major retail channels in 15 states. Make data-driven decisions in the fastest-growing beverage category.
150+
Retail Locations
Daily
Data Updates
The Market Opportunity
Hemp-Derived THC Beverages Are Scaling Faster Than Anyone Expected
The hemp-derived THC beverage category is rapidly expanding through major retail channels in states across the country, creating a multi-billion dollar market opportunity that traditional cannabis data providers can't see.
Texas Market Highlight
$1.2M
Retail revenue in 3 weeks (1 retailer)
95,628
Units sold Jan 1-21, 2026
211
Store locations carrying THC beverages
$12.80
Average price per unit
Retailer Spotlight
Inside the Nation's Largest Independent Wine & Spirits Retailer
Our newest coverage tracks THC beverage distribution, pricing, and inventory across 110 locations in 14 states - giving unprecedented visibility into how the category is scaling through mainstream alcohol retail.
110
Stores carrying THC beverages (Jan 2026)
680
Products listed on shelf
(Jan 2026)
40
Census-based Statistical Areas (CBSAs) (Jan 2026)
166
Active Brands
(Jan 2026)
A Wide-Open Competitive Landscape
With 166 brands on shelf and the top five controlling just 10% of distribution, this is one of the most fragmented categories in beverage alcohol. No single brand has locked up the shelf - the window for emerging brands to gain meaningful placement is still wide open.
Geographic Reach
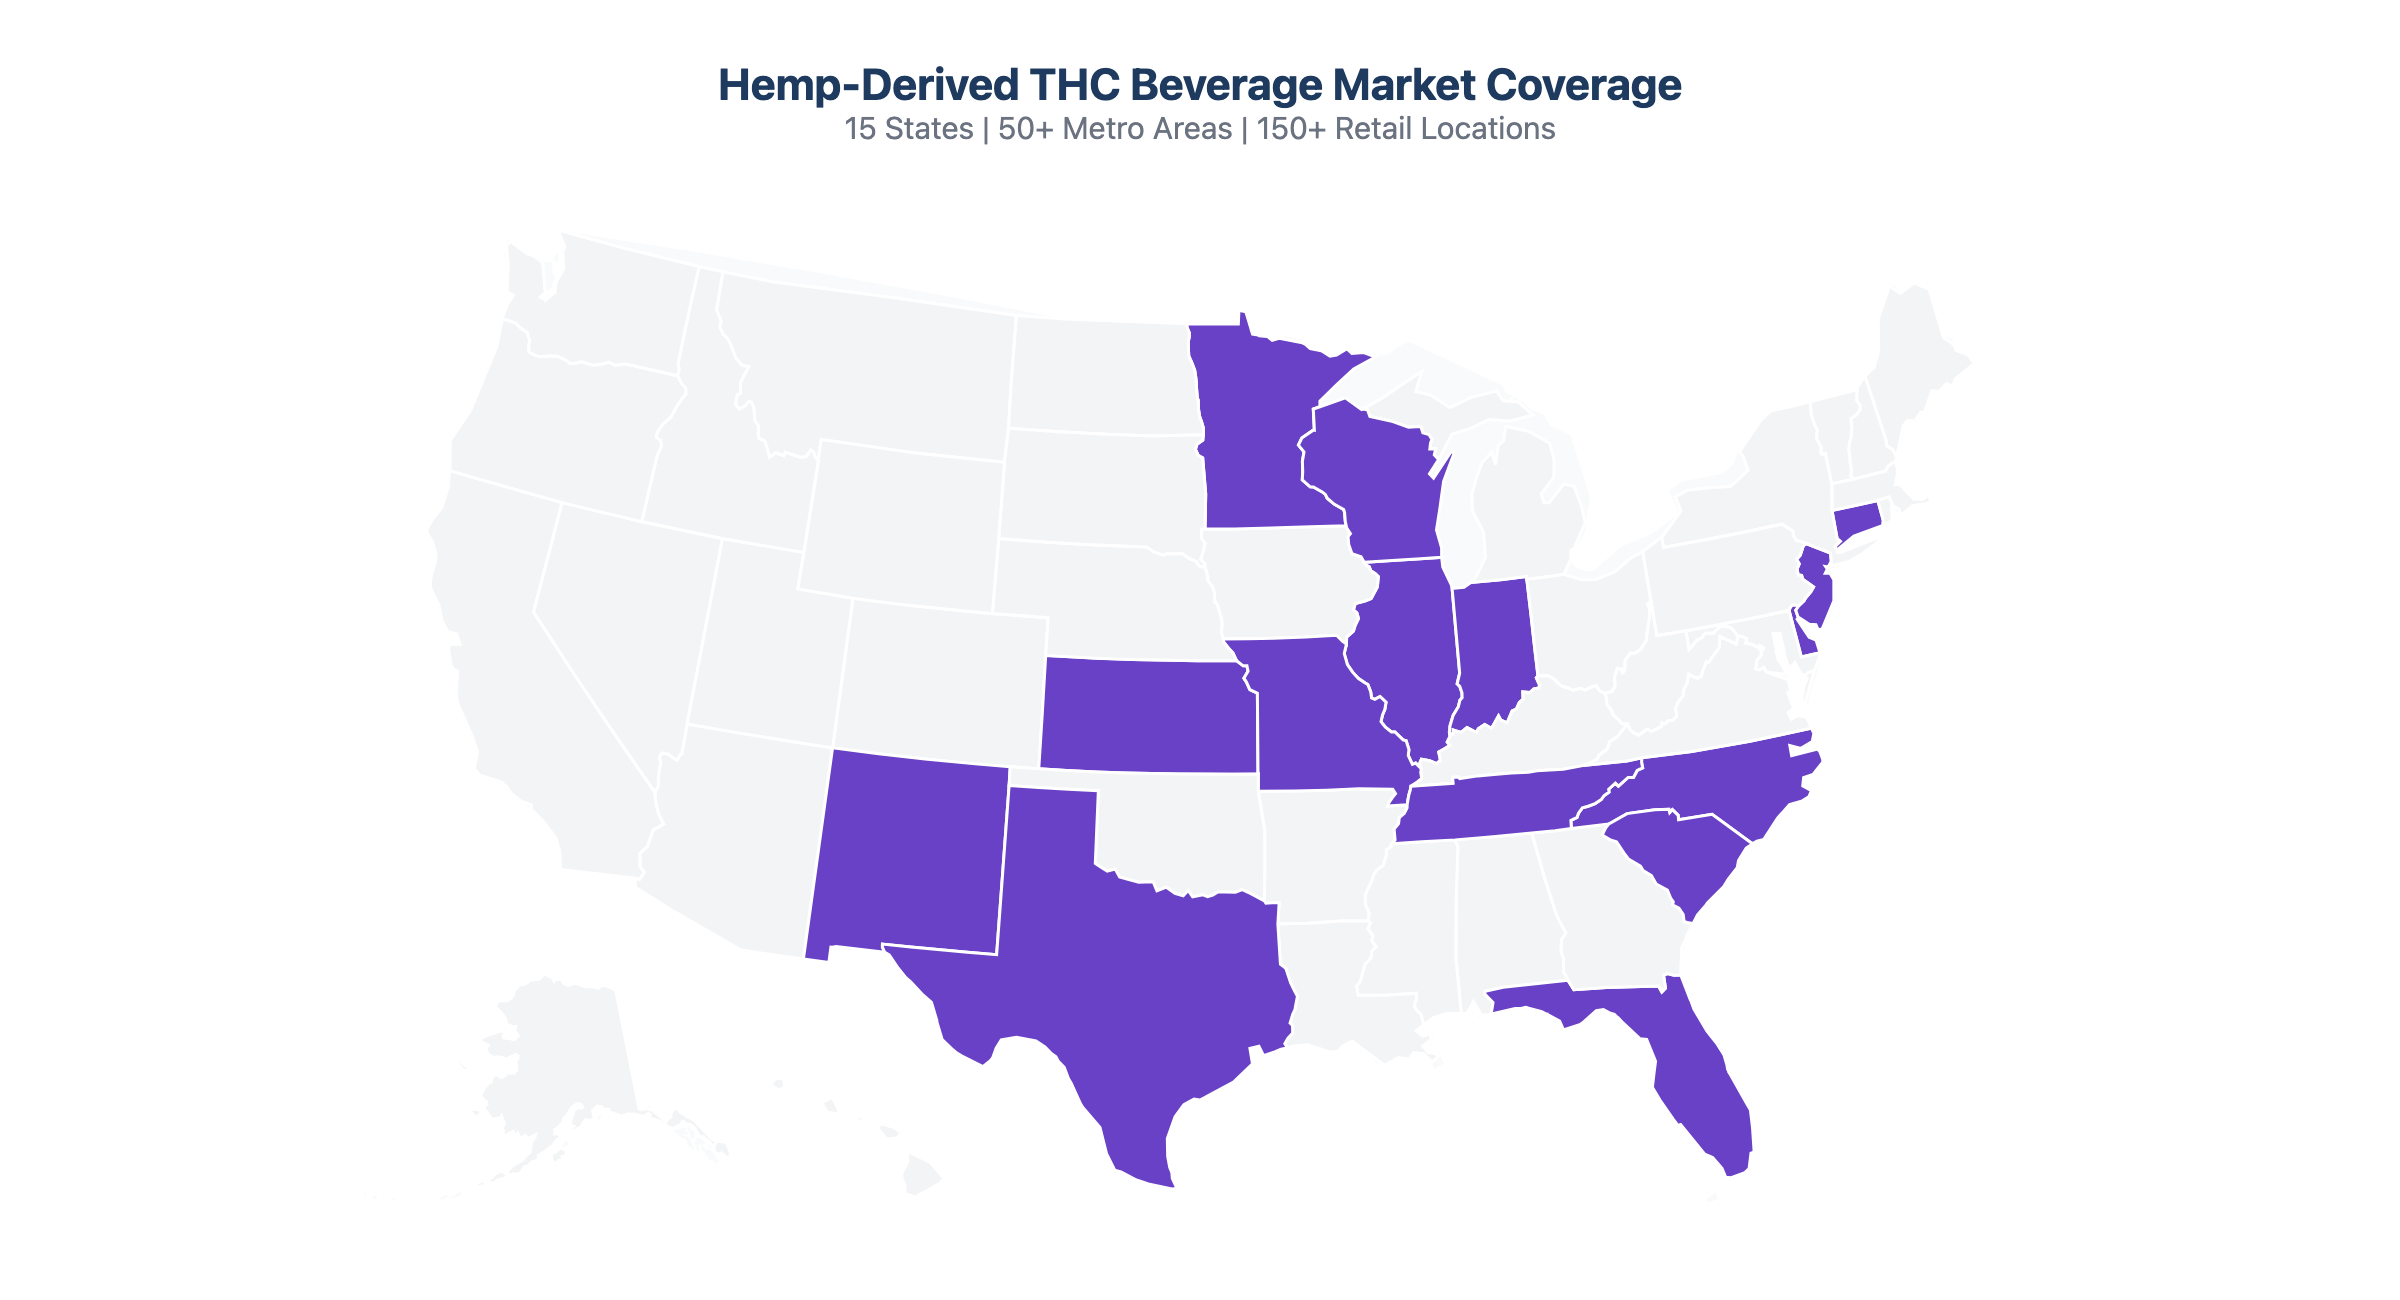
Nationwide Market Coverage
Our data spans the fastest-growing hemp-derived THC beverage markets, covering major retail chains across 15 states from coast to coast.
[Coverage Map — 19 States, 65+ Metro Areas]
Heading
Capabilities
What We Track
Comprehensive retail intelligence across six core dimensions, giving you the complete picture of the hemp THC beverage market.
Distribution & Availability
Track which products are on shelf, where, and how distribution is expanding across 150+ retail locations in 50+ metros.
Pricing Intelligence
Monitor retail pricing, identify price segments, and track competitive positioning across every market we cover.
Sales Performance
Inferred sales velocity, revenue estimates, and unit movement at the store, metro, and state level — updated daily.
Stock-Out Monitoring
Identify out-of-stock events and availability gaps across the entire retail footprint to spot supply chain issues early.
Brand & Product Analytics
Comprehensive brand scorecards, product-level performance, format analysis, and portfolio benchmarking across channels.
Geographic Market Analysis
CBSA-level performance breakdowns across 50+ metropolitan areas in 15 states, from major metros to emerging markets.
Data in Action
Sample Insights From Our Data
Here's a glimpse of the market intelligence our platform delivers. These findings are drawn from just three weeks of January 2026 data.
Market Insight #1
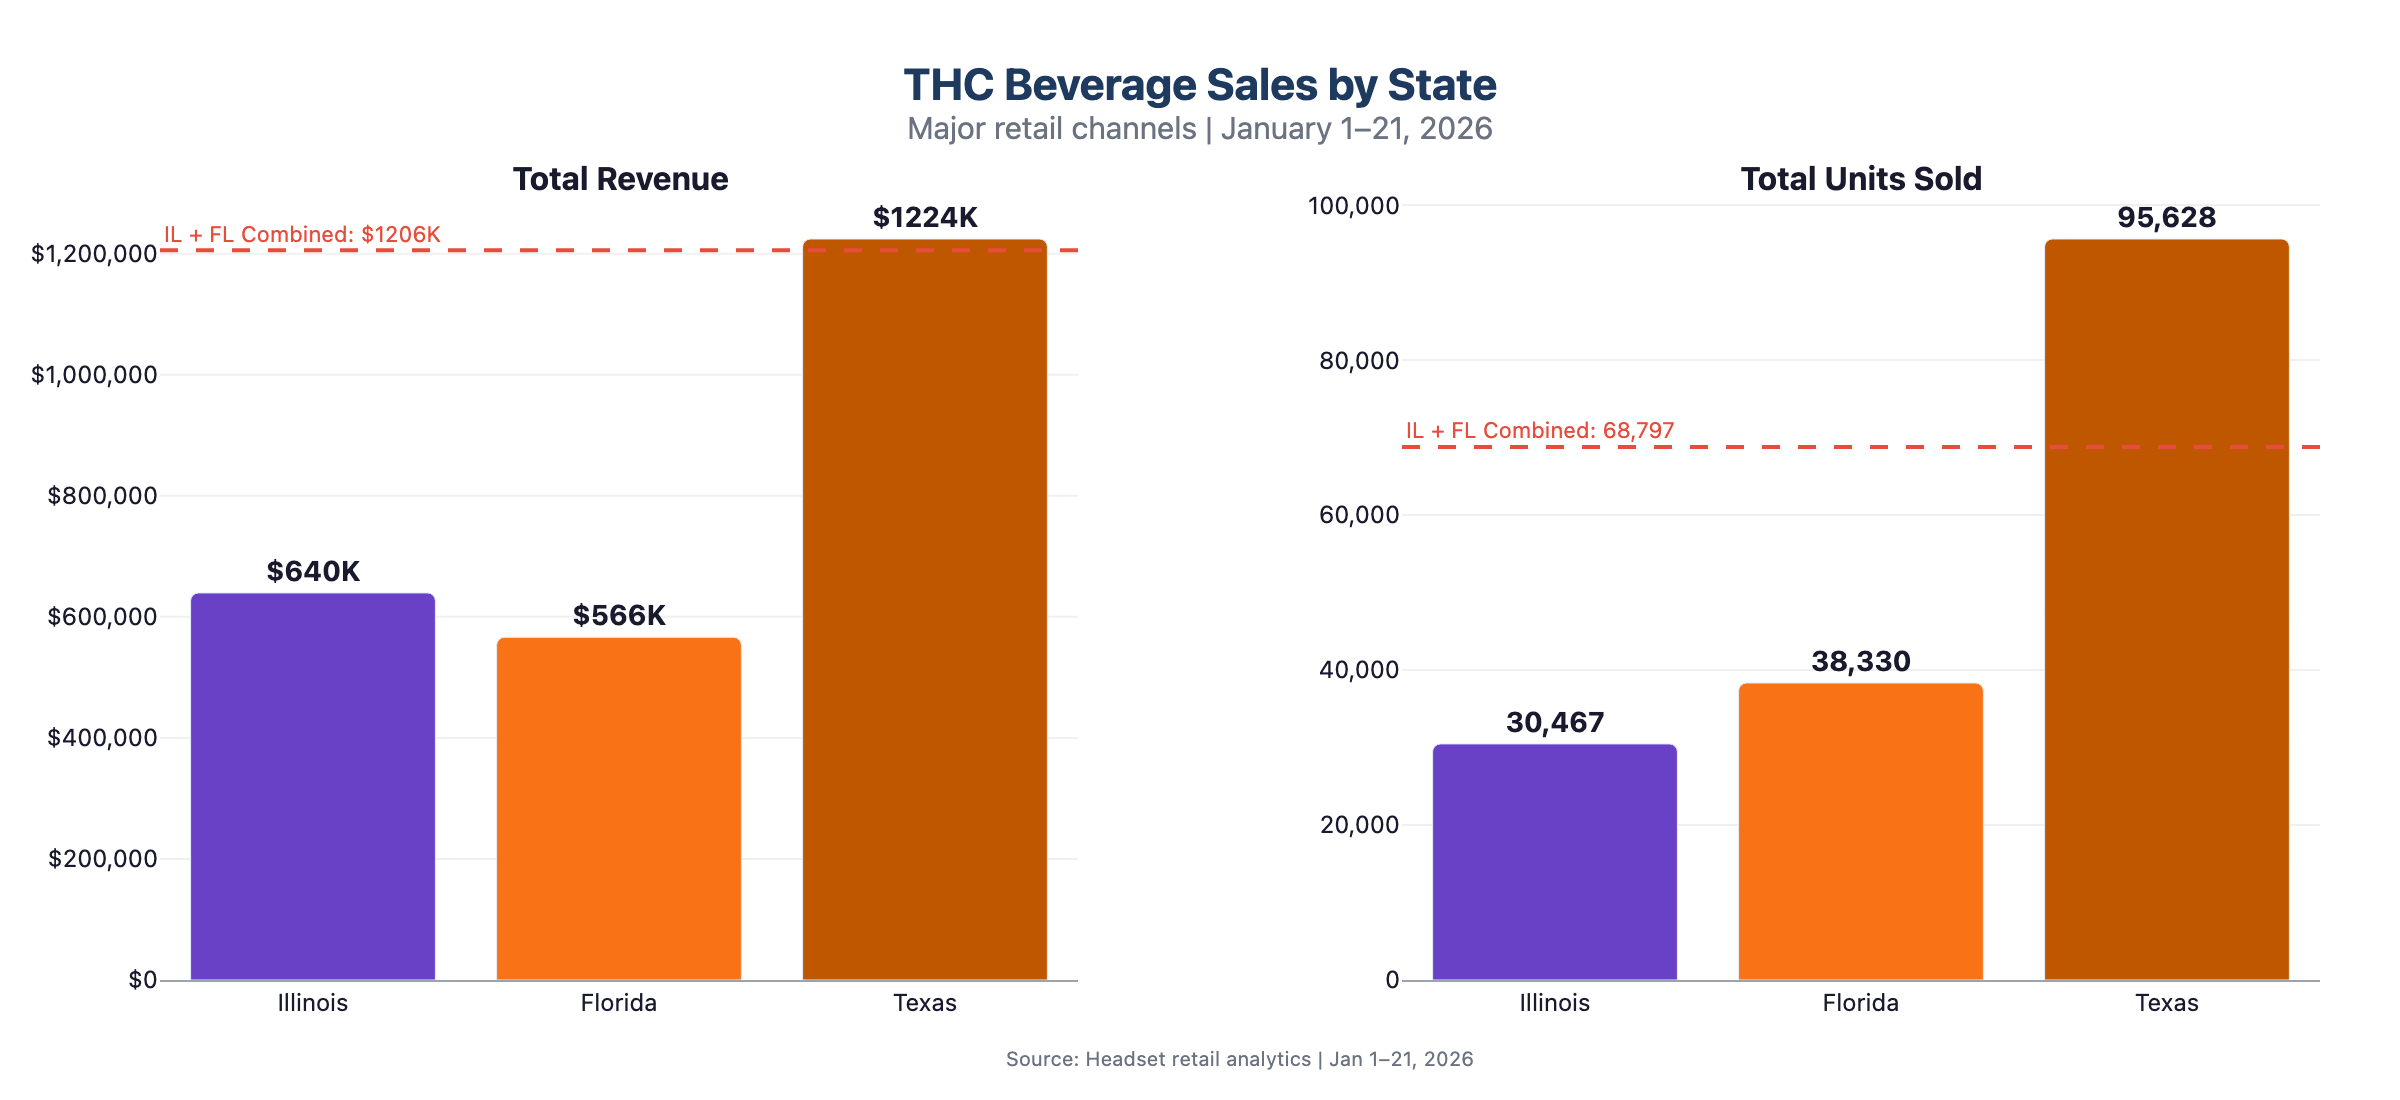
Texas Is Leading the Volume Race
A single state generated more THC beverage revenue through major retail channels than two other tracked states combined. Texas moved 95,628 units in just 17 selling days, driven by accessible pricing and strong distribution across 211 store locations.
Market Insight #2
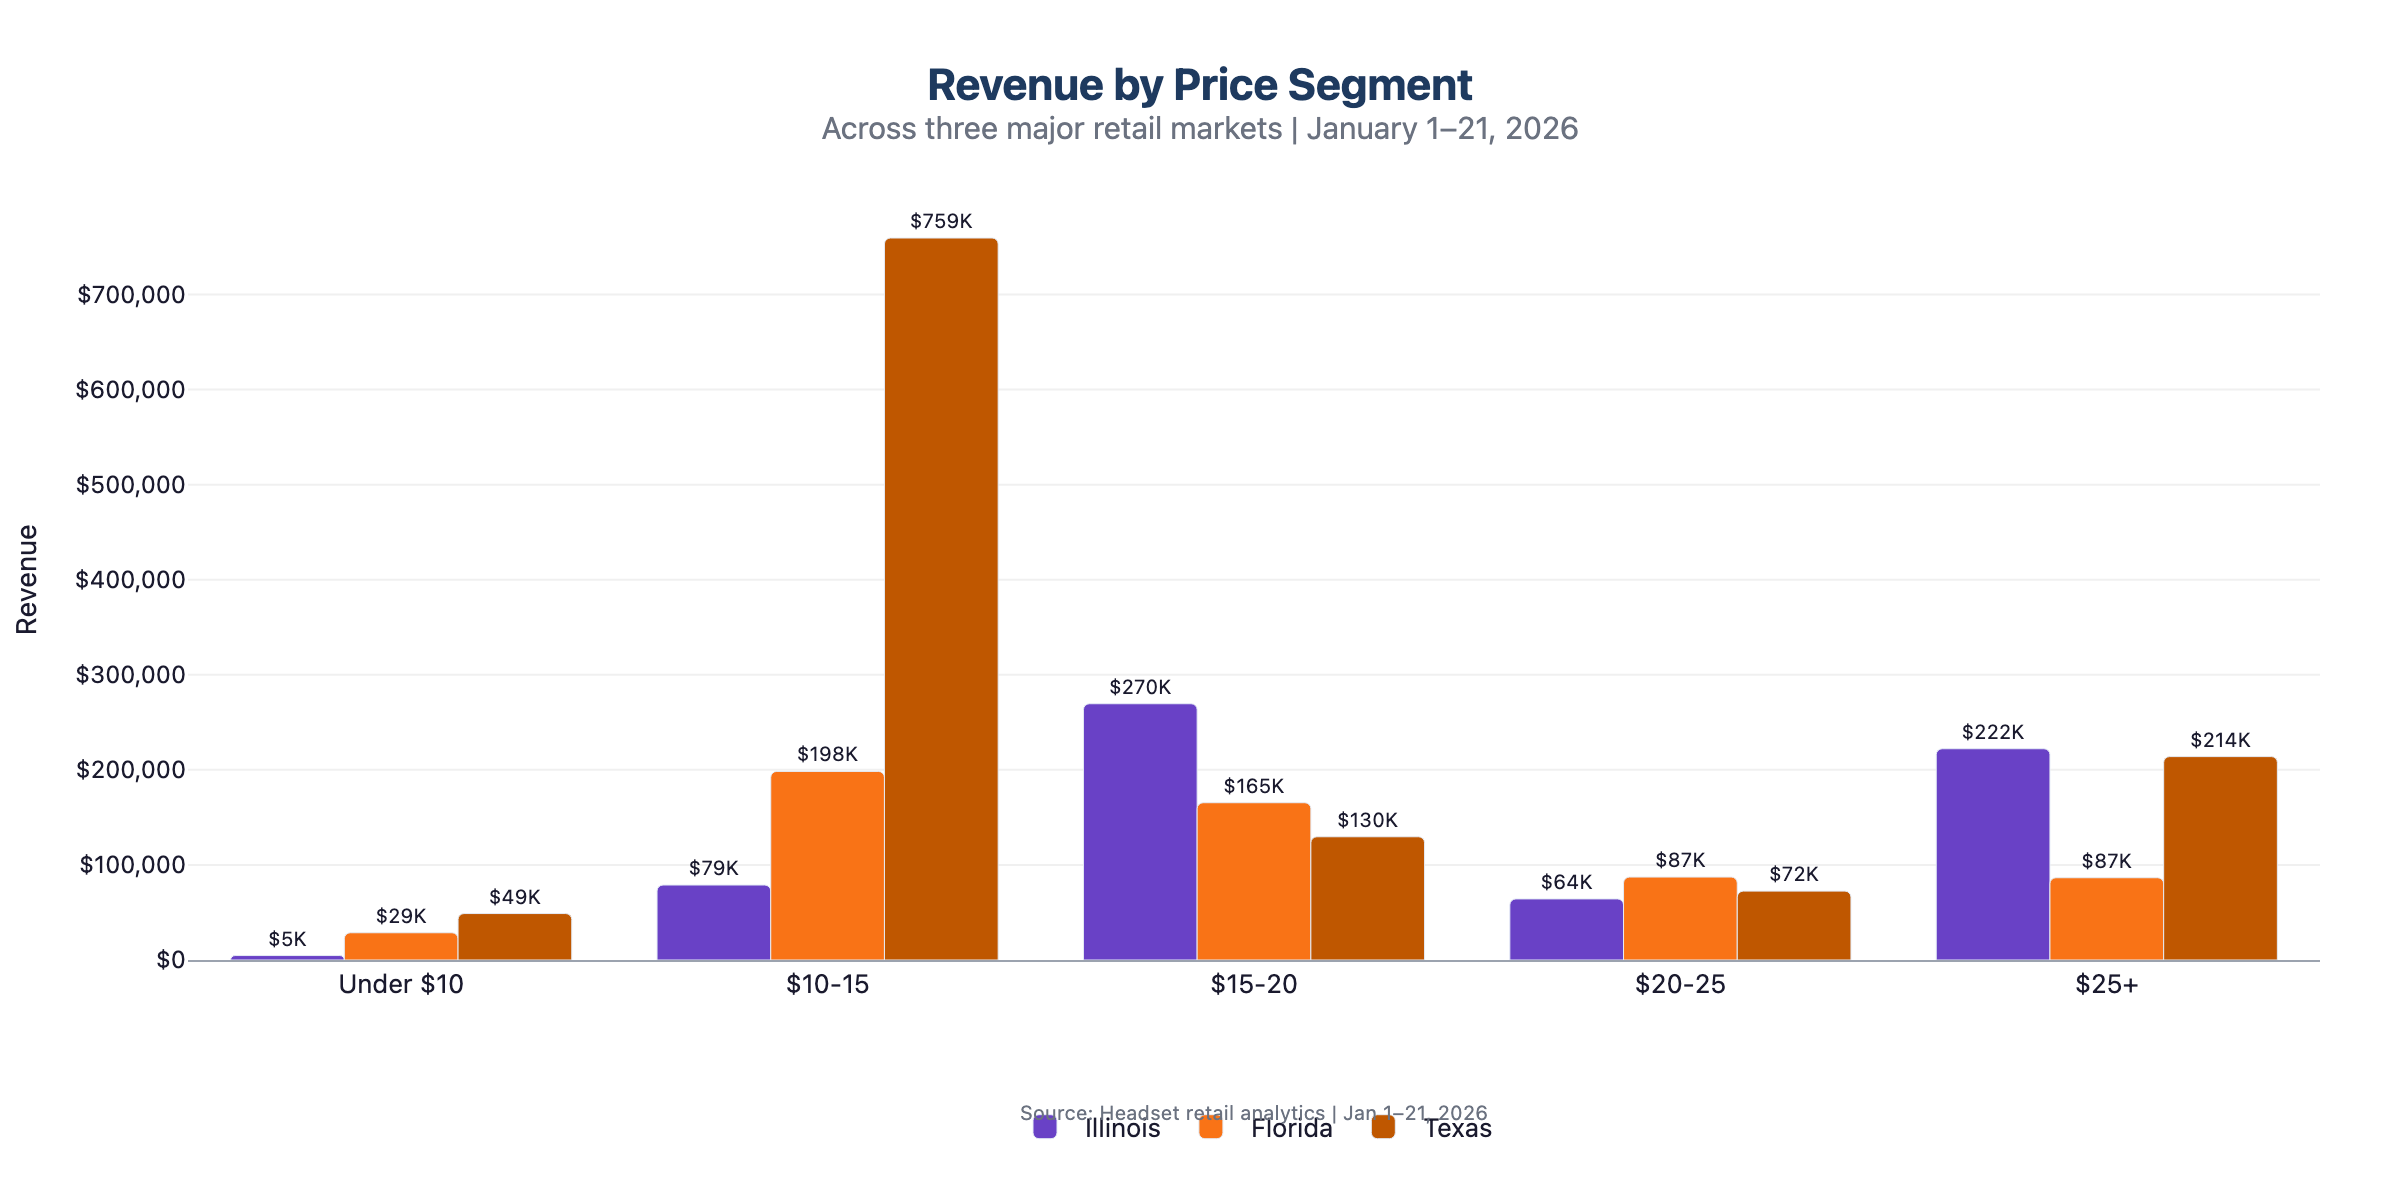
The Market Is Bifurcating Into Two Distinct Segments
Our data reveals a striking split in the THC beverage category. In some markets, the average selling price exceeds $20, with premium products above $25 capturing 35% of revenue. In others, the $10–15 segment drives 67% of total volume.
Market Insight #3
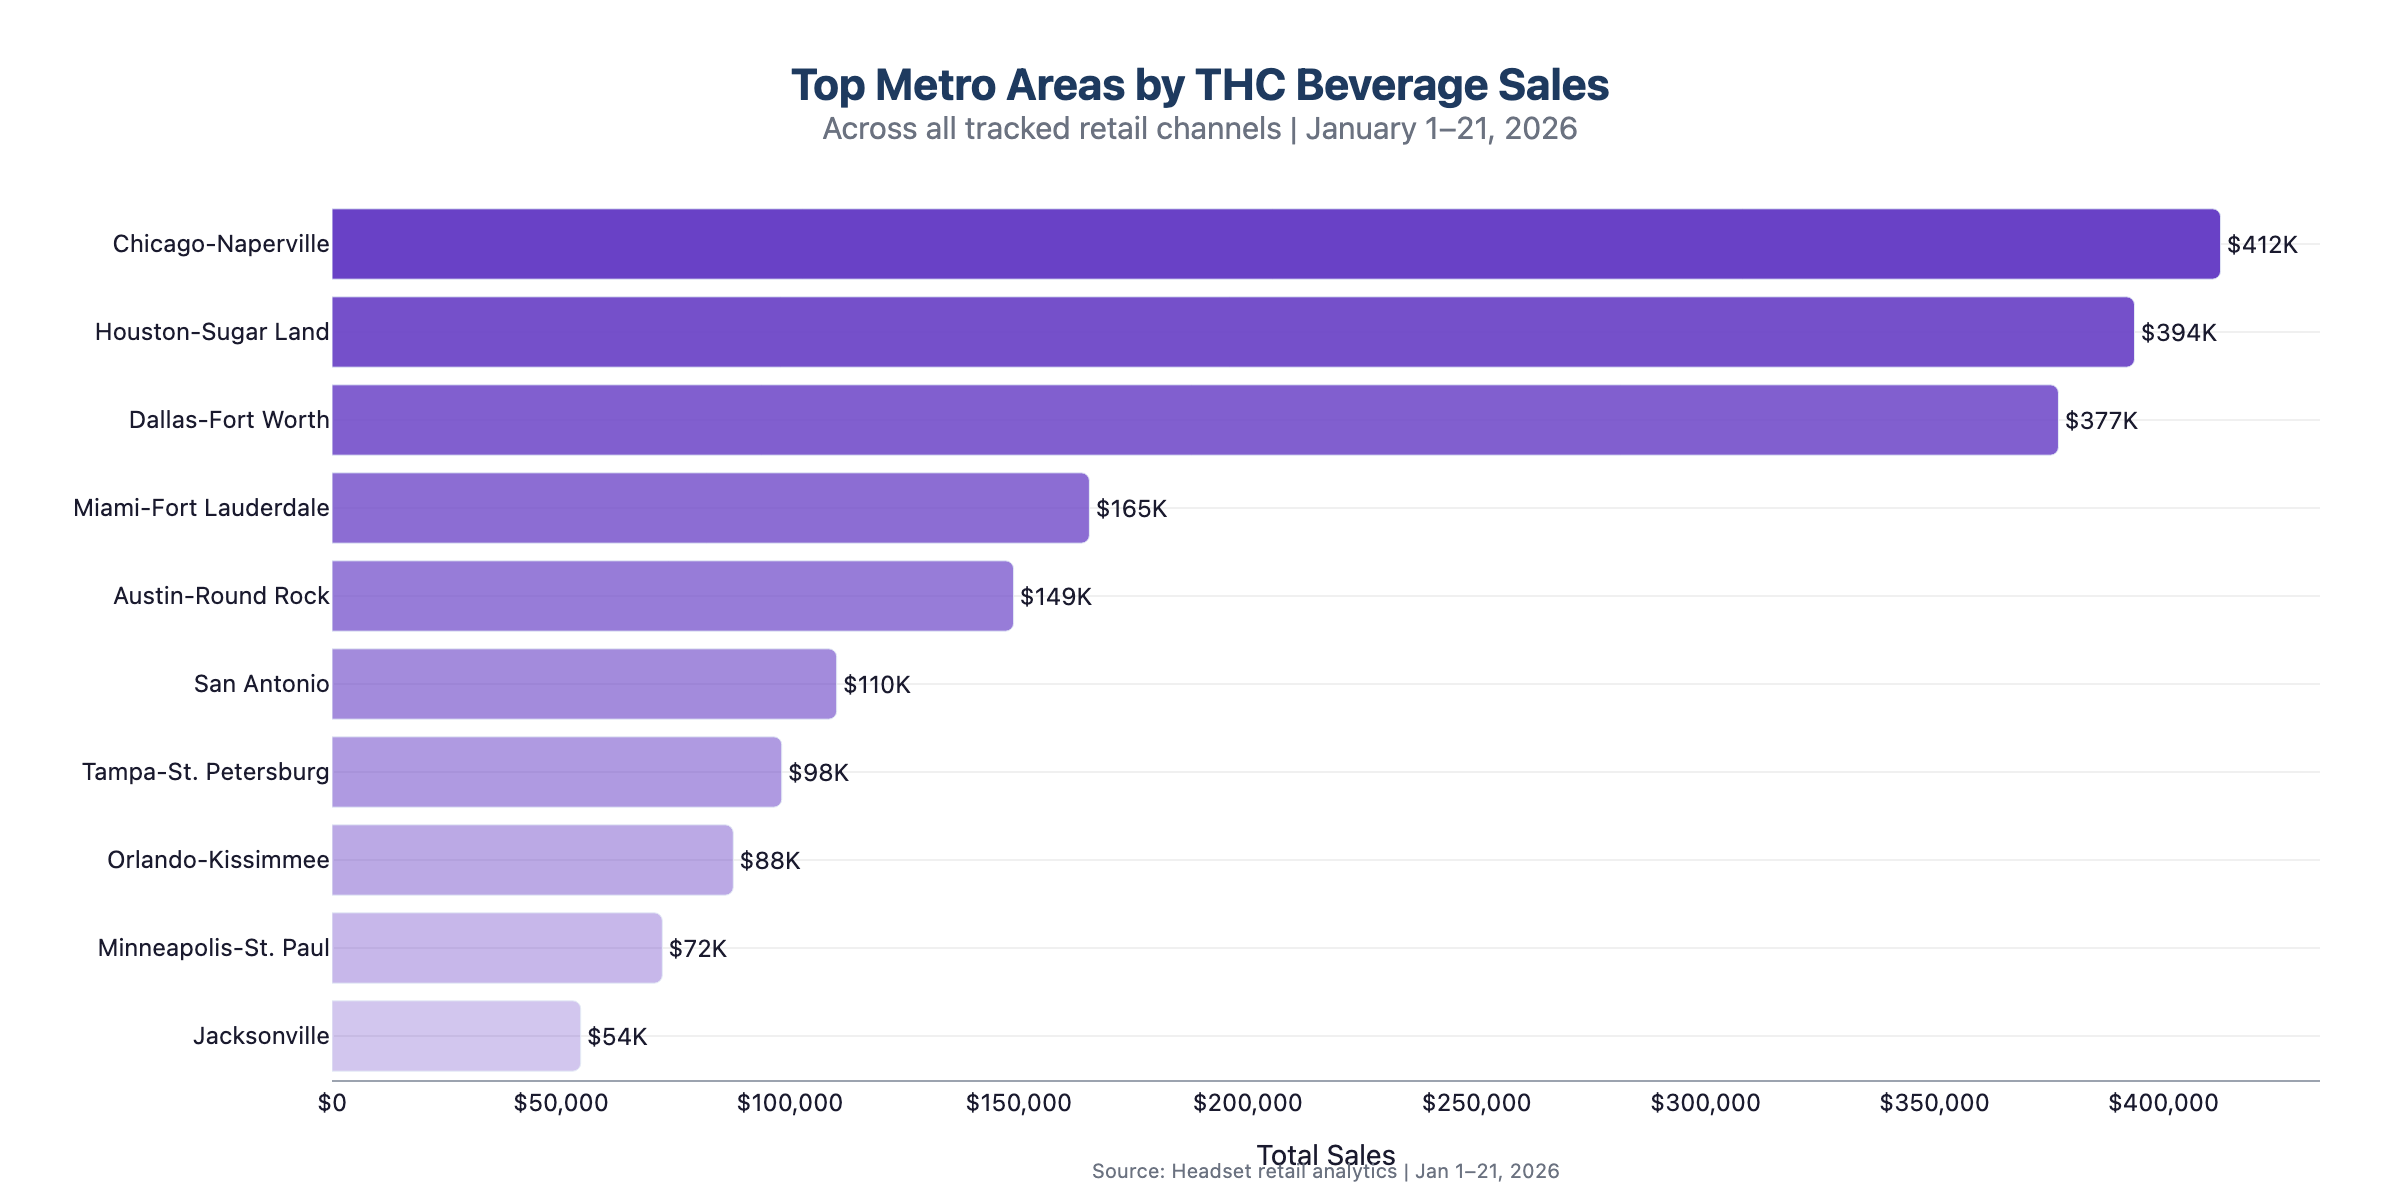
Geographic Performance Varies Dramatically by Metro
Our CBSA-level analysis reveals that performance is highly concentrated. In Texas, Houston and Dallas-Fort Worth alone account for over 60% of statewide revenue. Understanding which metros are driving growth is critical for distribution strategy.
Data Preview
See What the Data Looks Like
A representative snapshot of the market-level data available in our platform. Drill into any state, metro, brand, or product.
Texas
211 stores • 19 brands • $12.80 avg • 5,625 daily units • $72K daily rev
Illinois
41 stores • 52 brands • $20.99 avg • 1,523 daily units • $32K daily rev
Florida
50 stores • 32 brands • $14.77 avg • 1,917 daily units • $28K daily rev
Use Cases
Built for Industry Decision Makers
Whether you're building a brand, managing a category, or evaluating investments, our data gives you the edge.
Brands & Producers
Understand your competitive position, optimize pricing strategy, identify distribution gaps, and benchmark your velocity against the category in every market you serve.
Retailers
Make data-driven category management decisions. See which brands and price tiers are performing across comparable markets and optimize your shelf strategy accordingly.
Investors & Analysts
Track market growth trajectories, brand momentum, and category development across 15 states. Ground your investment thesis in real retail performance data, not estimates.
Deeper Analytics
Brand & Trend Intelligence
Beyond market-level data, we provide brand positioning analysis and daily trend tracking to identify emerging opportunities in real time.
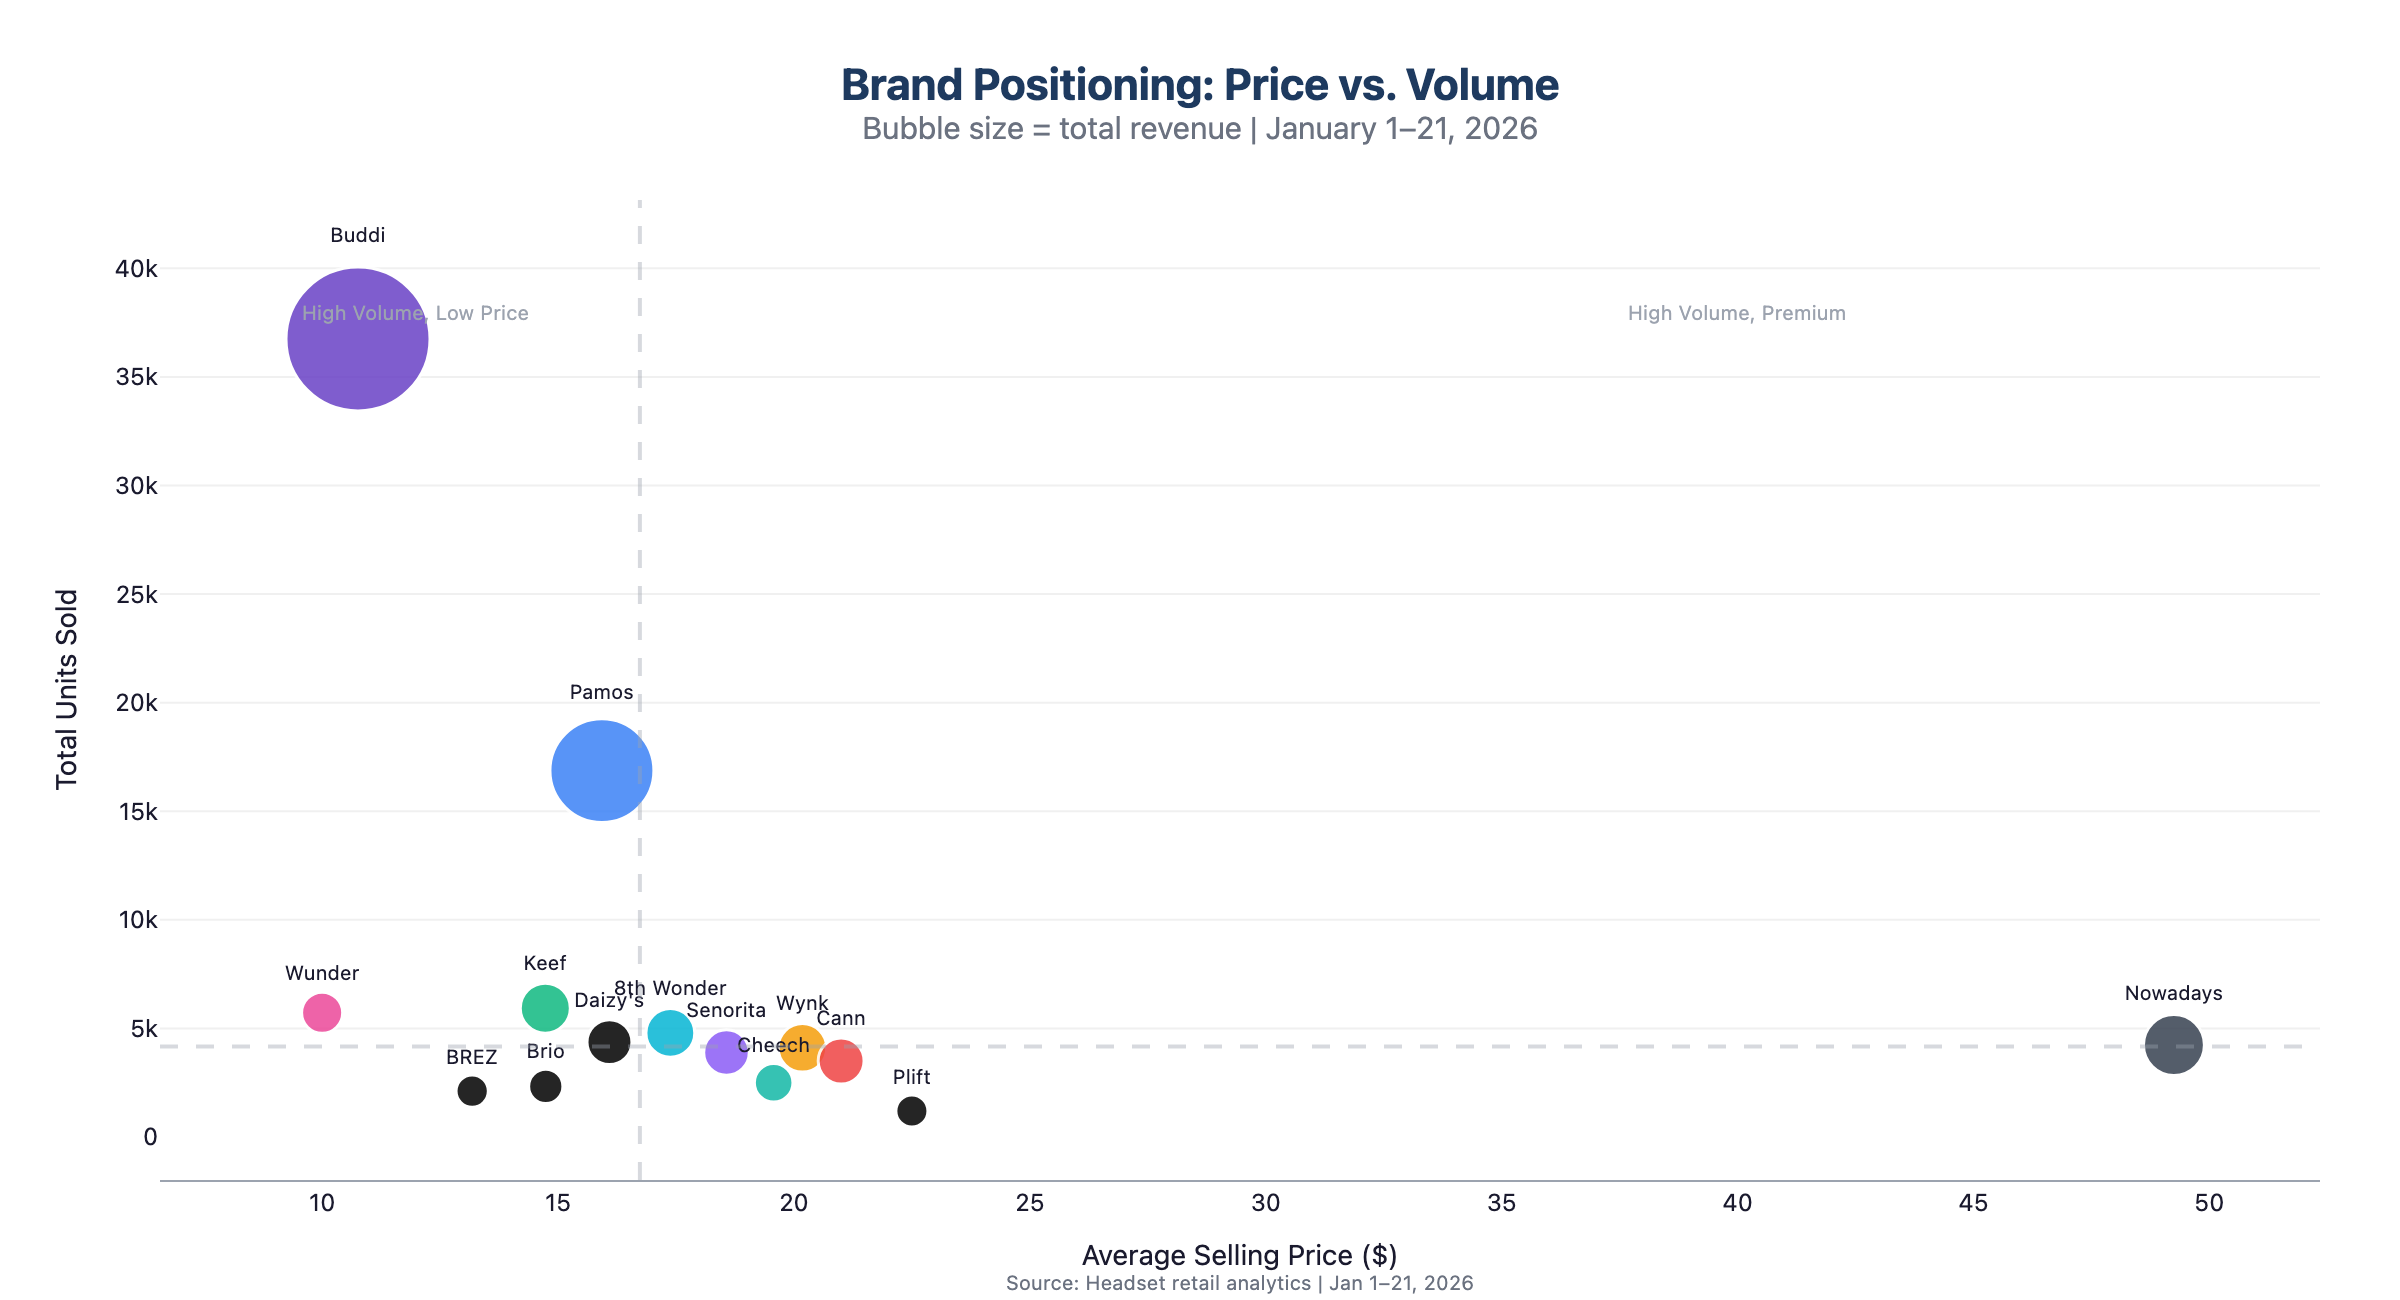
Brand Positioning Analysis
Understand exactly where each brand sits in the market. Map price positioning against volume performance to identify competitive white space and emerging leaders.
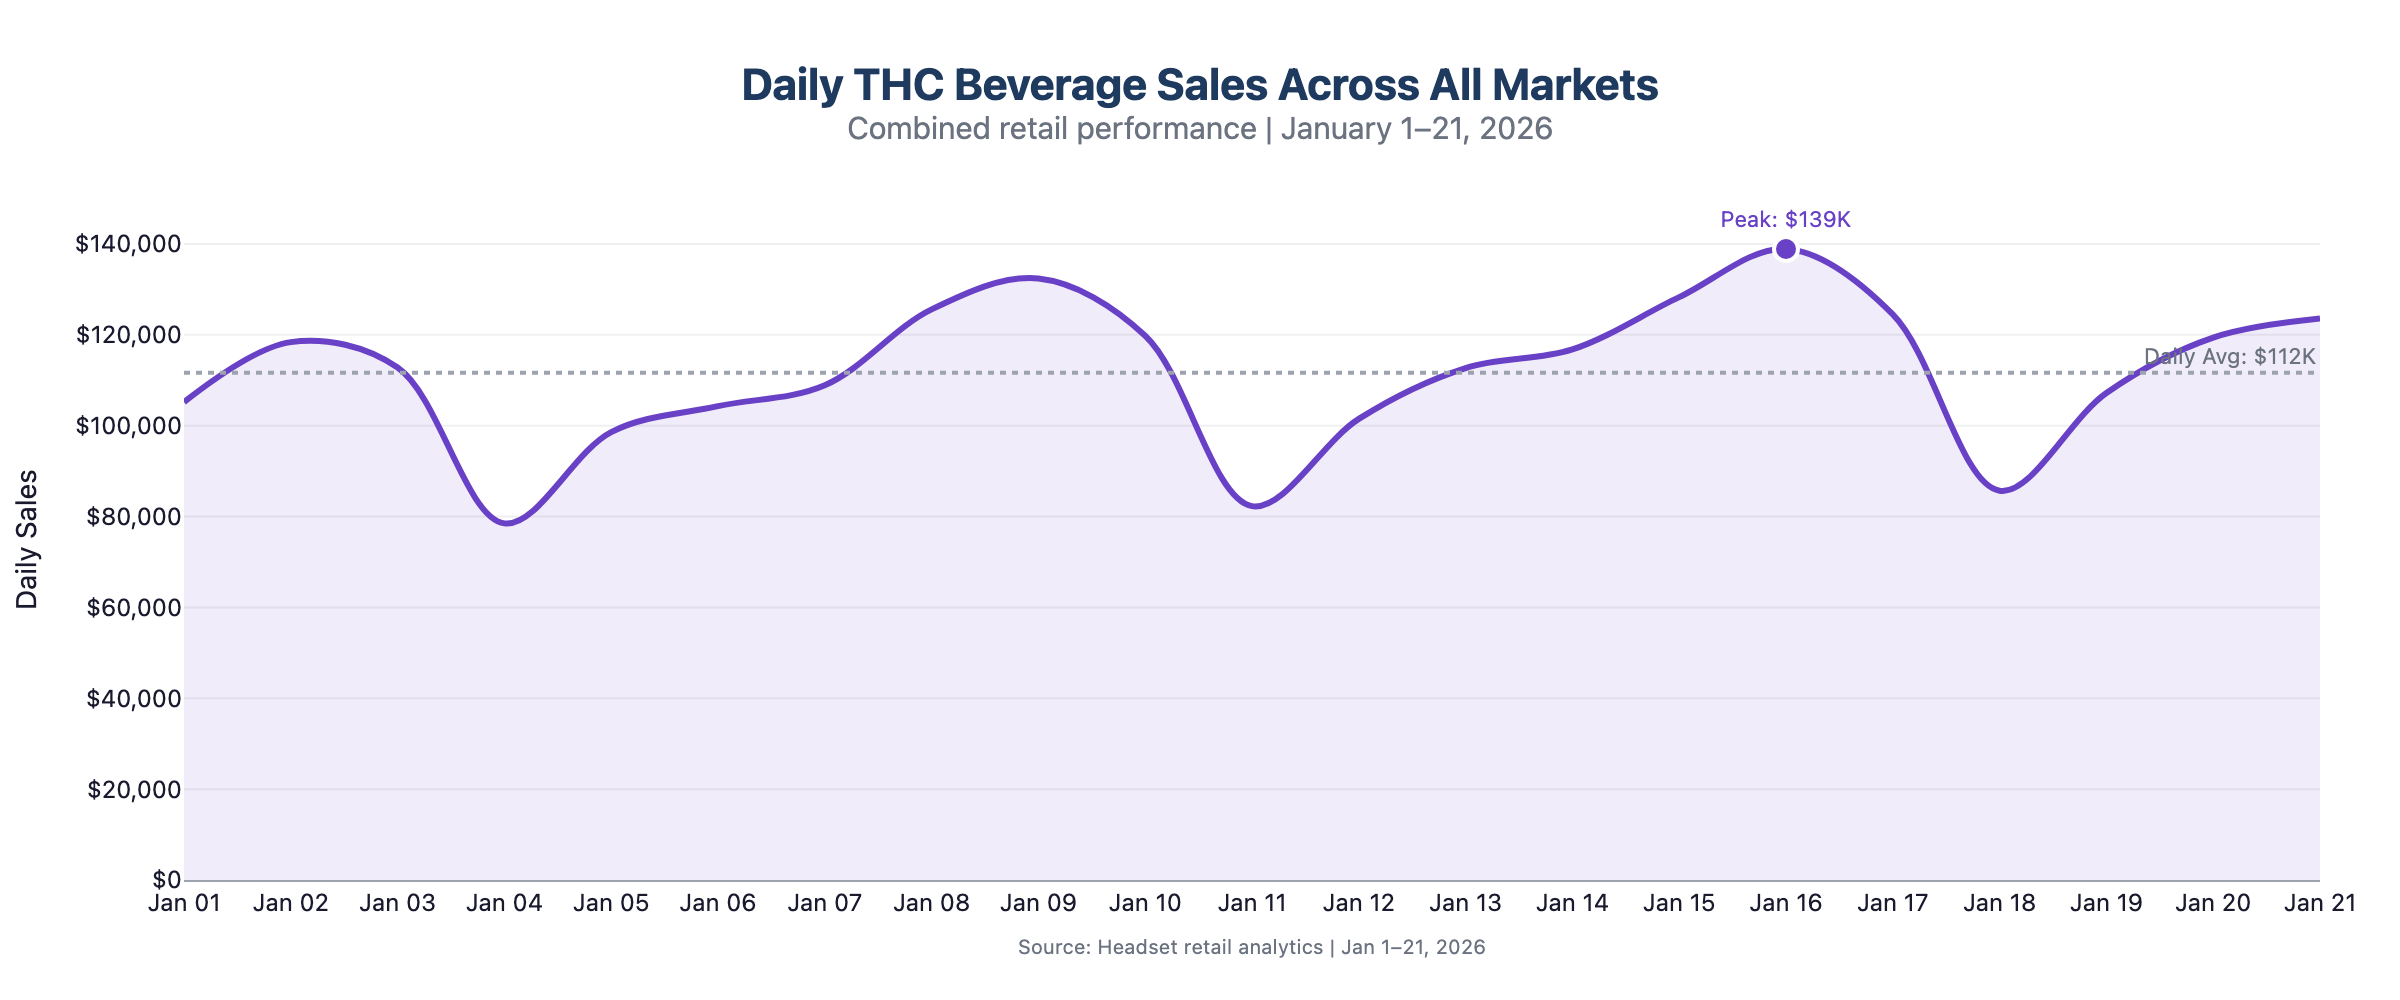
Daily Sales Tracking
Monitor day-over-day performance across all markets. Spot weekly patterns, identify acceleration points, and track category momentum as it builds.
Geographic Reach
Nationwide Market Coverage
Our data spans the fastest-growing hemp-derived THC beverage markets, covering major retail chains across 15 states from coast to coast.
See What the Data Can Do For You
Get access to the most comprehensive hemp-derived THC beverage retail dataset. Updated daily across 15 states.
Or reach out directly: sales@headset.io