

Beyond the Brownie: A 2026 Cannabis Edibles Deep Dive

Introduction
Edibles are often the on-ramp for the mainstream cannabis shopper. Their broad appeal draws a consumer who is rarely the focus of cannabis operators, and the familiarity they offer is something other categories struggle to match. Straddling wellness and recreation, Edibles cover a lot of ground, accounting for roughly 11% to 12% of US cannabis sales.
People have long been acquainted with eating their high, but formulation has come a long way from the pot brownies of old. A new class of confections, with precise dosing, targeted experiences, and convenient formats, continues to push this old-school category forward. Still a hotbed of innovation, Edibles are medicine for some, a first cannabis experience for others, and a smokeless alternative for the masses. They are a pillar of the modern cannabis market.
This Q3 2026 report examines where the category stands today, where it is headed, and the innovations shaping modern Edibles, including Canada's March 2025 rule change that let co-packs bundle multiple 10mg units into one package and reshaped the shelf.
Methodology
Data for this report comes from real-time sales reporting by participating cannabis retailers via their point-of-sale systems, which are linked to Headset's business intelligence software. Headset's data is very reliable, as it comes digitally direct from our partner retailers. However, the potential does exist for misreporting in the instance of duplicates, incorrectly classified products, inaccurate entry of products into point-of-sale systems, or even simple human error at the point of purchase. Thus, there is a slight margin of error to consider.
Unless otherwise noted, sales data is from ON, AB, SK, BC markets in Canada and WA, OR, CA, AZ, CO, MI, FL, MA, NV, MD, IL, NY, OH, NJ, CT, MO markets in the US. The following analysis reports on sales occurring in Q3 of 2026 unless otherwise indicated.
Key Takeaways
- Edibles are holding in the US and gaining in Canada. US Edibles keep their loyal buyers and their place on the shelf, but faster-moving inhalables are capturing the new dollars. In Canada, Edibles are growing across the market.
- In Canada, a rule change reshaped the shelf. Updated regulation put 100mg co-packs on the shelf, and shoppers trading up to them have lifted both Edible dollars and average item price.
- Function is the product in both markets. Blends and the newer cannabinoids are growing while standard THC products fade. CBD and CBN are the most common in the US, while CBG is the clear winner in Canada.
- Gummies dominate in both markets. In the US no other format is close, while in Canada Caramels, Chews and Taffy are gaining share, a natural fit for co-pack lines.
- Edibles follow the holiday calendar in both markets. Share peaks in December and slows through the summer.
- In the US, Edibles are losing ground to inhalables. Fewer baskets include an Edible, and prices have compressed as brands compete for a flat pool of dollars, though the decline is slowing.
- The buyer is older and more likely to be female than the market in both countries. Edibles reach a customer that inhalables miss. In the US, younger shoppers remain underrepresented, while in Canada Gen Z is beginning to narrow the gap.
Sales Performance
Assortment
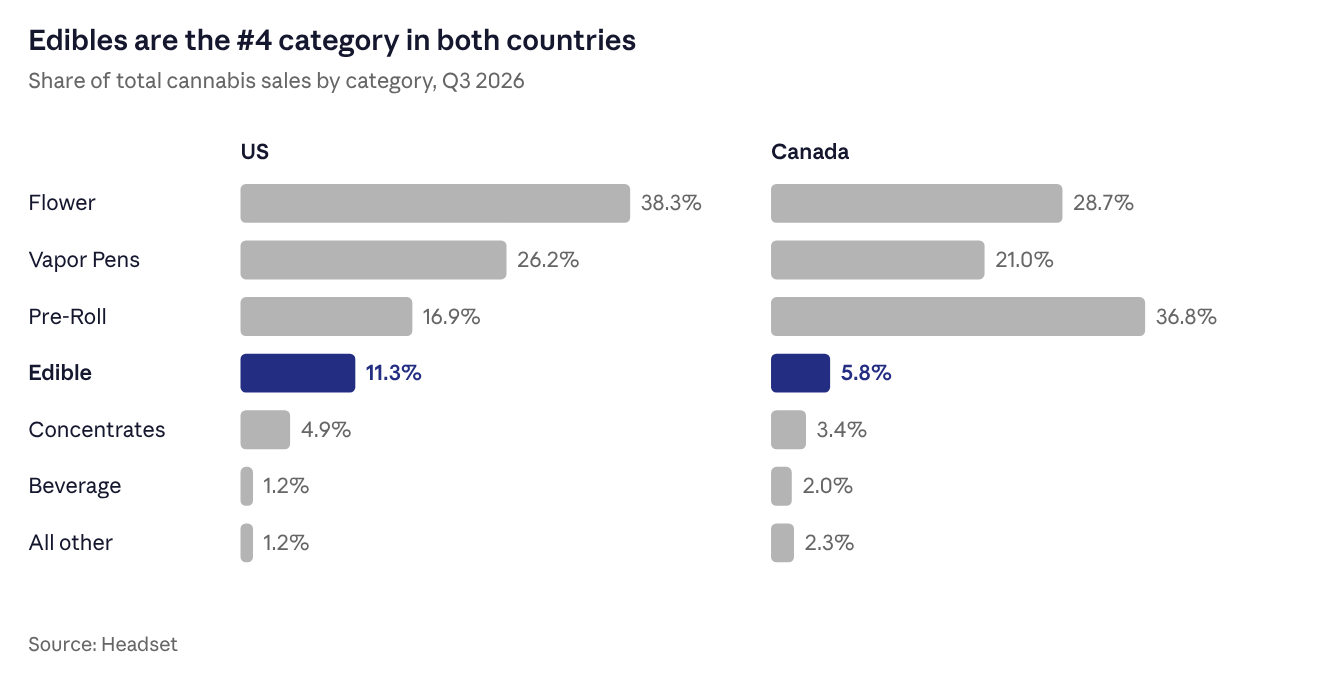
In the US, Edibles are the fourth-largest cannabis category, taking 11.3% of sales behind Flower (38.3%), Vapor Pens (26.2%), and Pre-Rolls (16.9%). Momentum is soft: share slipped 0.4 points YoY and 0.5 points from Q2. Dollars held at $716.2M against $714.2M a year ago, so the category is not shrinking, but faster-growing inhalables are capturing the incremental dollar.
In Canada, Edibles are also the fourth-largest category, at 5.8% of sales, a legacy of the federal 10mg-per-package cap that kept the category small and low-priced for most of its history. Edible dollars grew 12.8% YoY, adding $7.3M CAD in a market that added $4.6M CAD overall, and share rose 0.6 points.
Market Analysis
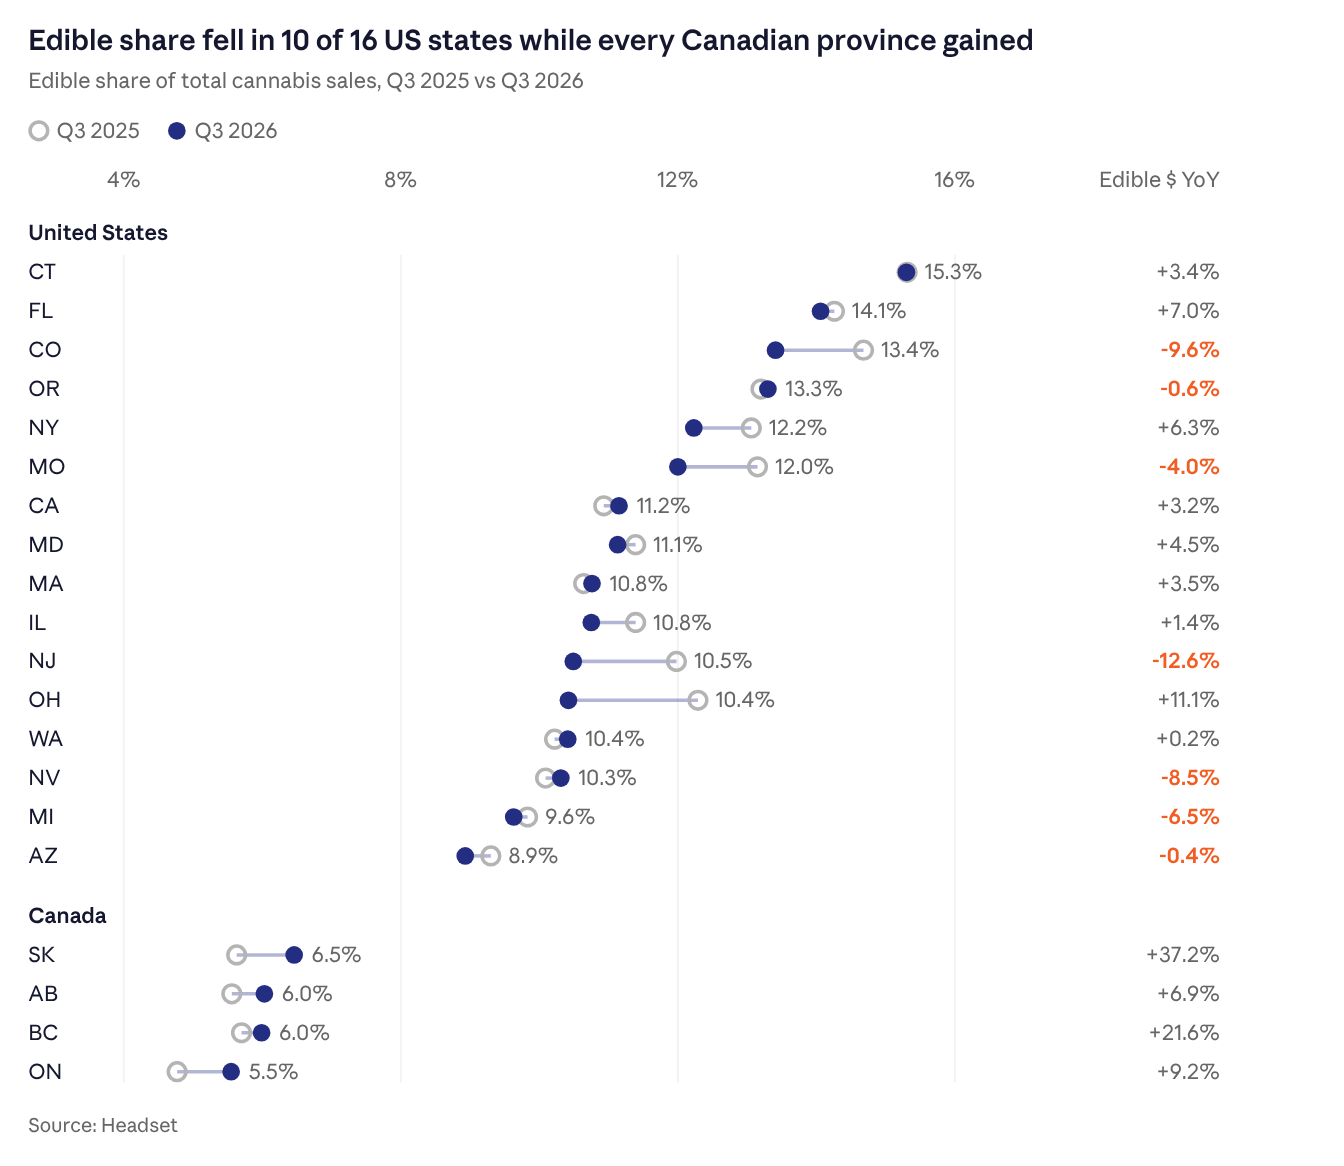
Connecticut is the most Edible-friendly market we track at 15.3% share, followed by Florida (14.1%) and Colorado (13.4%). Arizona (8.9%) and Michigan (9.6%) sit at the bottom, both markets where low-priced inhalables dominate the shelf.
The largest share losses came from newer East and Midwest markets, but they do not all mean the same thing. Ohio fell 1.9 points even as Edible dollars grew 11.1%, because the total market grew about 31% as adult-use sales scaled. New Jersey is the genuine decline, with share down 1.5 points and Edible dollars down 12.6%. Colorado lost 1.3 points and nearly 10% of its Edible dollars, and Missouri gave back 1.2 points. California, Washington, Nevada, Massachusetts, and Oregon each posted small share gains, a sign that the mature Western markets may have found a floor.
In Canada, all four provinces gained share. Saskatchewan led at 6.5% (+0.8 points) with Edible dollars up 37%, BC dollars grew 22%, and Ontario posted the largest relative share gain at +16%. A result this uniform points to a national cause rather than a provincial one, which the dose data below makes clear.
Category Performance Over Time
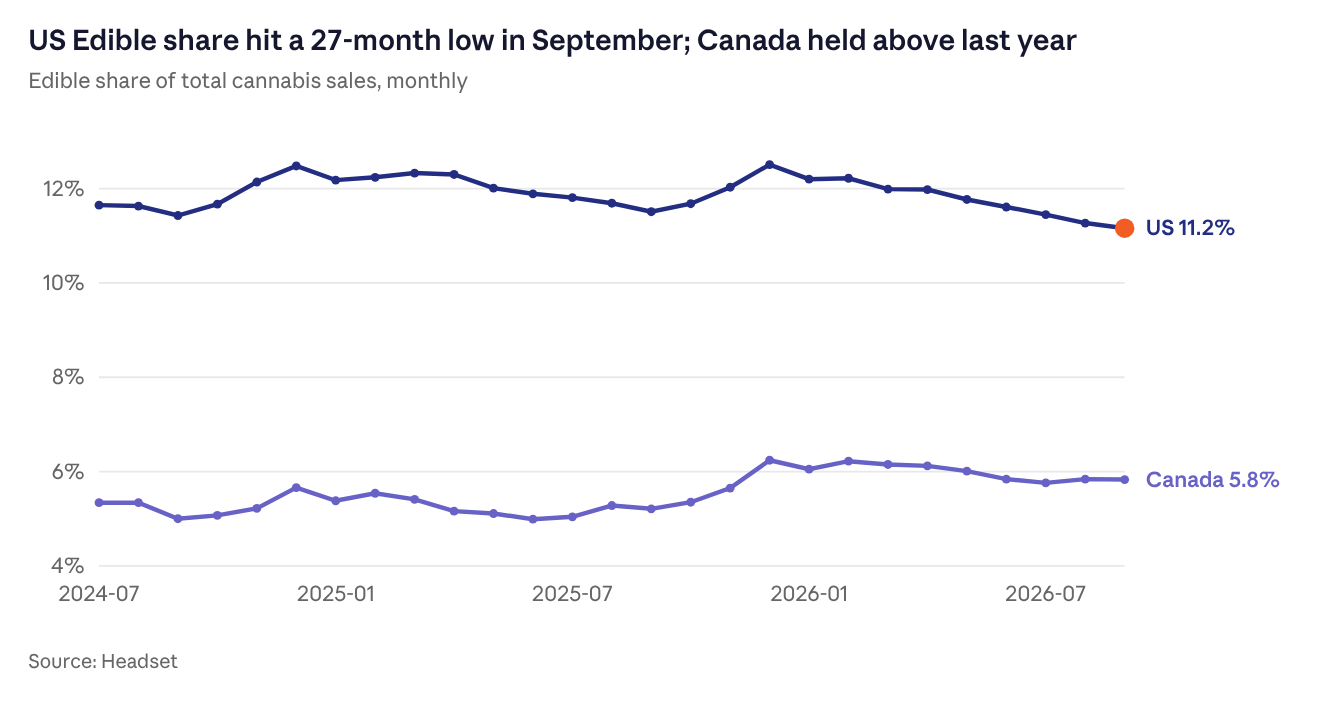
Twenty-seven months of data show a US category with a clear holiday rhythm and a slowly sinking baseline. Share peaked at 12.5% in December of both 2024 and 2025, then drifted lower through the following summer. What has changed is the floor: September 2026 came in at 11.2%, the lowest month in the window. If the Q4 holiday lift fails to clear 12.5% again, that would point to structural rather than seasonal erosion.
Canada's line breaks in two. Share ran flat between 5% and 5.7% through mid-2025, then stepped up as 100mg co-packs reached shelves. It hit 6.2% in December 2025 and has held between 5.8% and 6.2% since, about 0.7 points above where it sat a year earlier.
Seasonality
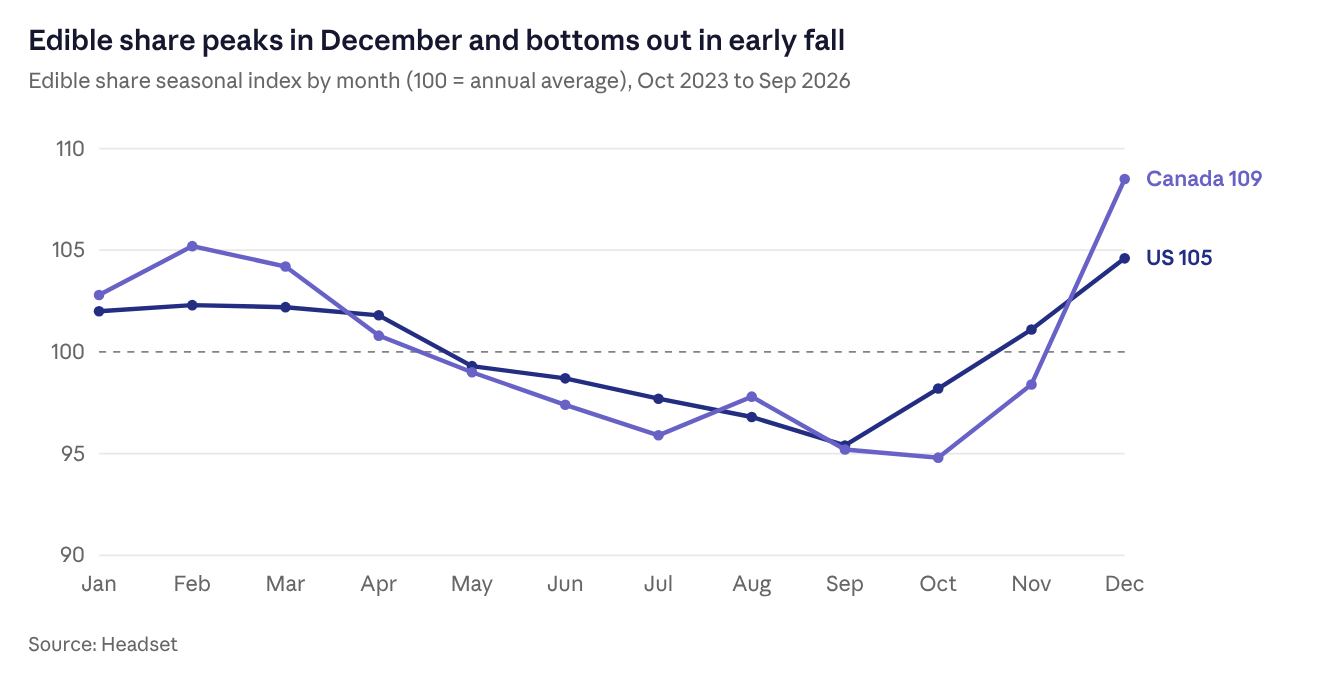
Edibles are a cold-weather, holiday-driven category in both markets, with sales high through the winter and slowing through the summer. In both the US and Canada, December is the peak, the highest-share days fall in the week before Christmas, and share runs highest on weekends. For retailers, the year runs on the winter peak: build stock and gift-ready displays from Thanksgiving through New Year's, treat 4/20 and Green Wednesday as volume days, and use the summer trough to clear slow-moving SKUs rather than read it as category decline.
Brand & Product Performance
Top Brands
Top Products
Brand Loyalty
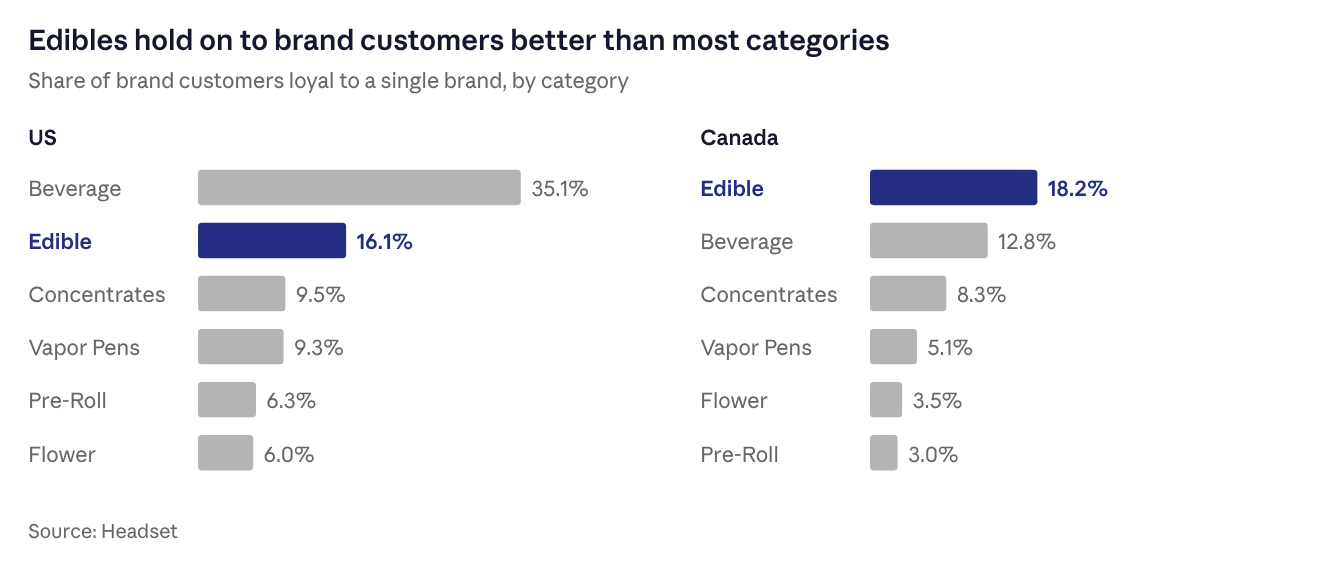
Edibles are a loyal category. In the US, Edible shoppers stay with a single brand more often than in any category except Beverages, and far more often than in Flower or Pre-Rolls, where shoppers move freely between brands. In Canada, Edibles lead every category.
Loyalty here reflects habit: a shopper who finds an Edible that delivers a reliable experience tends to stay with it. Loyalty also tracks the size of the brand field: it is highest in categories with the fewest brands, such as Beverages, and lowest in crowded, commodity-like ones such as Flower and Pre-Rolls, with Edibles in between. That raises the value of winning the first purchase. But it’s a strength to protect, not a moat, because about half of edible customers are eventually lost to competitors. Brand customers fall into three groups: loyal shoppers, about 16% in the US, buy only that brand; retained shoppers, about 30%, keep buying the brand but also buy others; and lost shoppers, about half, stop buying the brand altogether.
Metadata Traits
Segment
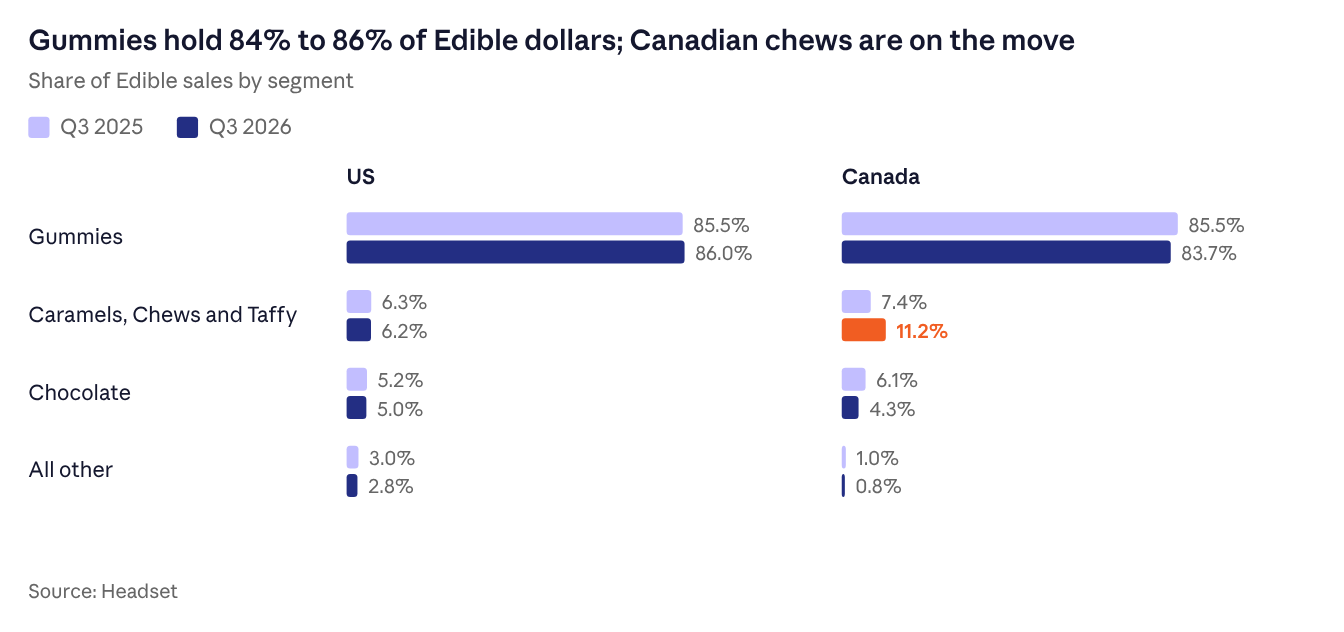
Gummies are the US category. They hold 86% of US Edible dollars, up half a point YoY, and every other format is a niche. Caramels, Chews and Taffy (6.2%) and Chocolate (5%) were roughly flat, Cookies lost a quarter of their share, and Savory Edibles were among the few small segments to grow (+8%).
In Canada, gummies hold 83.7% of Edible dollars, and the other formats are the ones in motion. Caramels, Chews and Taffy jumped from 7.4% to 11.2% of Edible sales, with dollar sales up 71% YoY, while Chocolate fell from 6.1% to 4.3%. Chews pack well into co-pack formats, where several individually wrapped 10mg pieces share one outer box, and hold their texture on a shelf, which positions them as the natural second format for brands building out 100mg lines.
Package Size
US
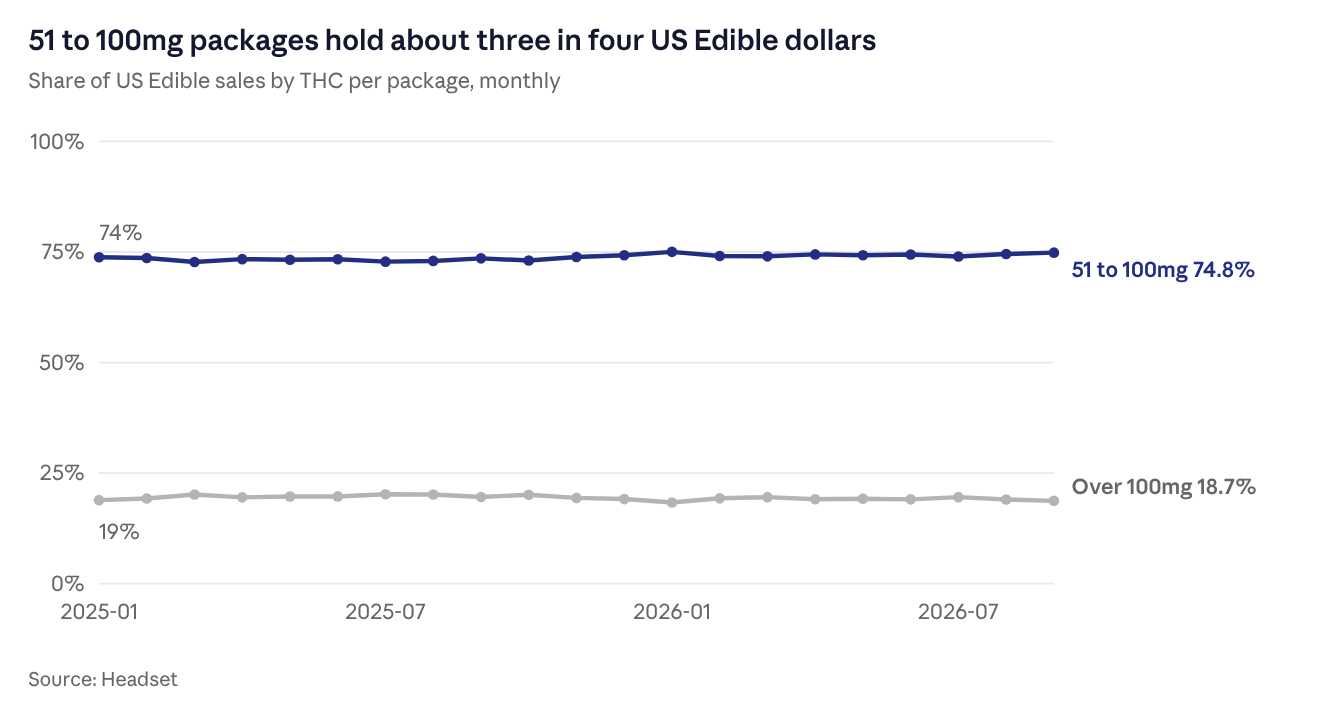
The US has long been a 100mg market, and the mix has barely moved since early 2025. Packages in the 51 to 100mg band hold 74.5% of US Edible dollars (+1.4 points YoY), and packages above 100mg hold 19.1% (-0.9 points). Low-dose packages at 10mg or less account for just 1.3% of sales.
Canada
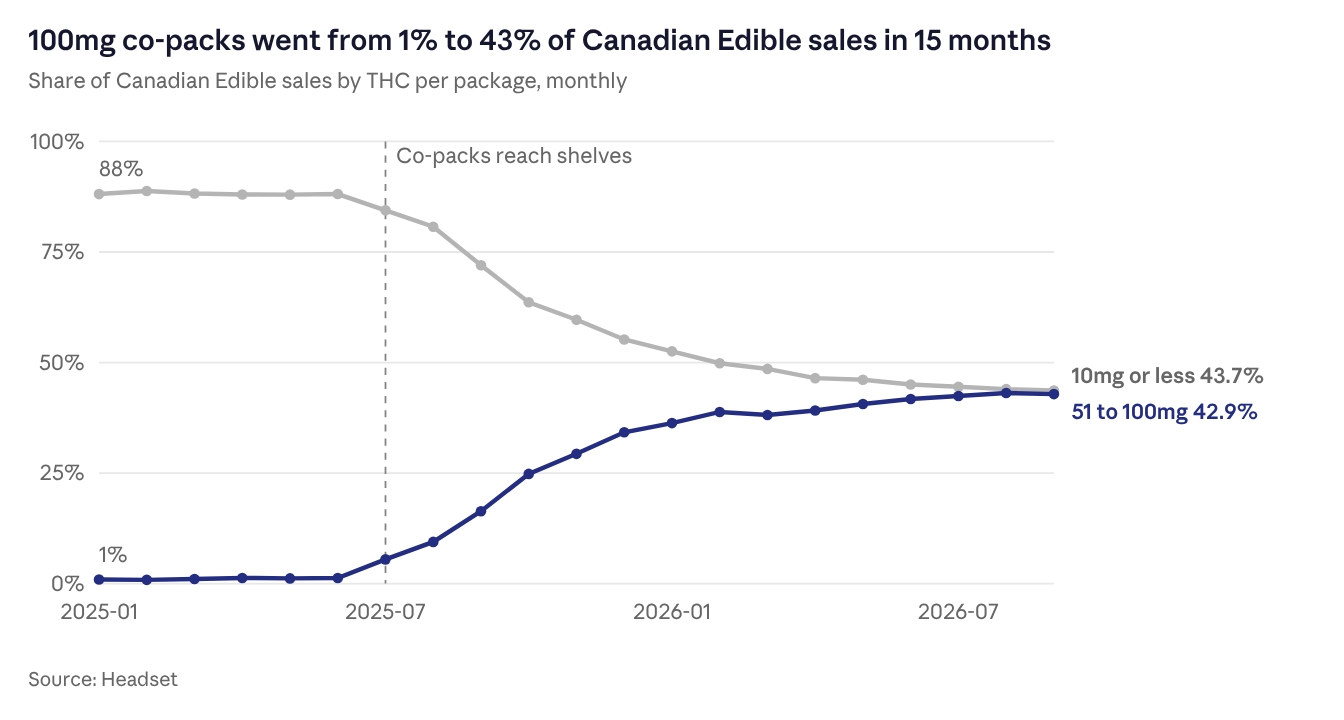
This is the biggest structural change in Edibles this year. In March 2025, Health Canada streamlined its packaging rules to allow co-packs, which bundle multiple 10mg units into one outer package. The per-unit limit did not change, but the shelf did. Co-packs in the 51 to 100mg band were 5.5% of Canadian Edible sales in July 2025, 16.4% by September, and 34.2% by December. By September 2026 they reached 42.9%, nearly matching single packs at 10mg or less (43.7%). Packages above 100mg added another 4.9%.
Co-packs explain why Canadian Edibles grew while the total market stood still. Shoppers who once bought a single 10mg pack are trading up to a box of ten, and the dollars followed.
Cannabinoid Ratios
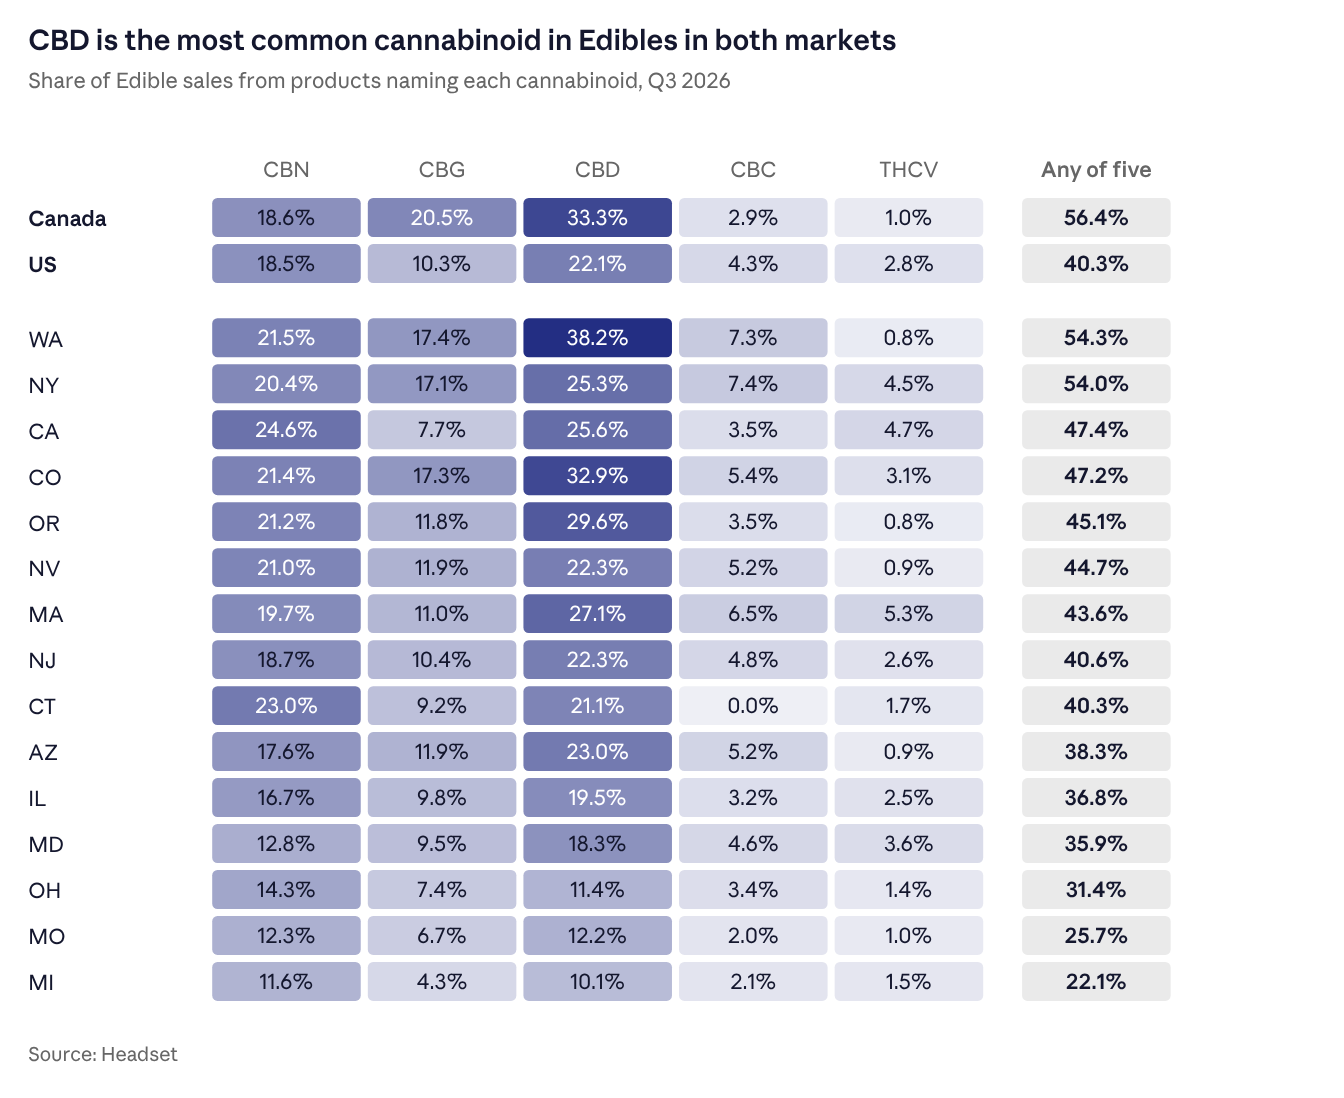
Function is driving growth in a flat category. About 40% of US Edible dollars now go to products naming CBN, CBG, CBD, CBC, or THCV, and blends that name two or more are growing about 11% while standard THC products decline. For retailers, the shelf is shifting from potency to purpose.
The newer cannabinoids are the ones gaining. THCV and CBC are growing fastest, though from a small base, while CBD and CBN remain the broadest and CBG is holding steady. The takeaway is that shoppers are willing to try new functions, but the established ones still carry the category.
In Canada, multi-cannabinoid products are also the fastest-growing group, up 28% against 17% for products naming none. CBG is the clear winner, and CBC is rising, while CBD is growing slower than the market and THCV has faded. Canadian shoppers are leaning toward blends, with CBG and CBN as the favored add-ons.
Adoption varies widely by state. Washington and New York are the most function-forward markets, with more than half of Edible dollars going to products naming one of the five cannabinoids, and California leads in CBN. Michigan, Missouri, and Ohio remain the most traditional, THC-forward markets, which are also the markets with the highest-potency packs on the shelf.
Basket Behavior
Penetration & Attachment
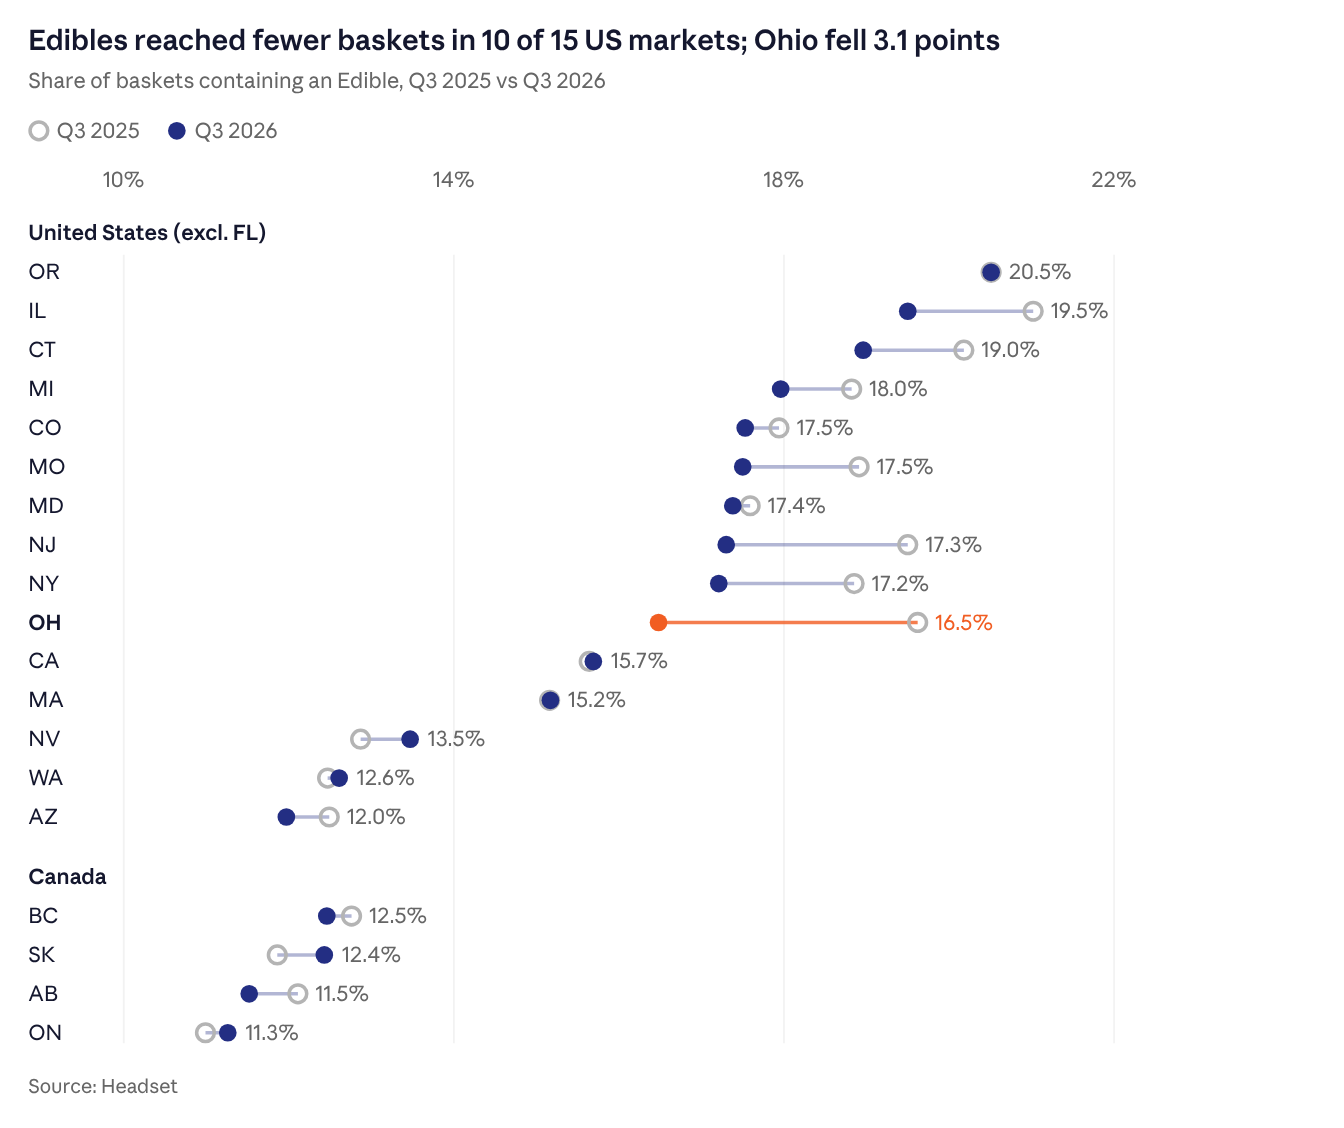
Edibles reach a minority of US baskets, and that reach is shrinking, most of all in the newer markets that are also losing dollar share. The slide is mild next to Flower, which lost shoppers in every market, but Pre-Rolls and Vapor Pens gained basket share while Edibles did not, so the category is losing ground to inhalables rather than riding a market-wide decline. Fewer shoppers adding an Edible is the clearest early signal behind flat US sales, and it suggests the challenge is getting Edibles into the basket, not keeping the shoppers who already buy them.
Canada tells a different story. Penetration is steady and moves in both directions, so growth is coming from shoppers spending more per Edible purchase, which is what a shift to co-packs would produce, rather than from more shoppers buying Edibles.
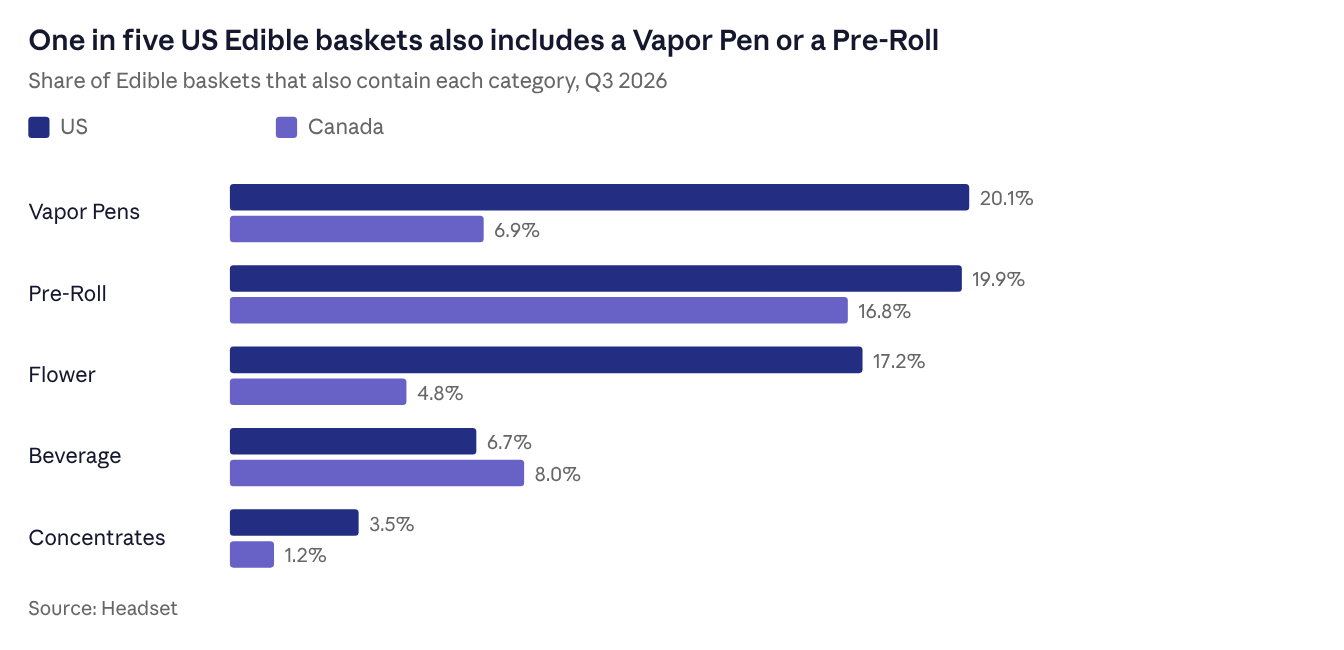
What else lands in the basket shows who the Edible shopper is. In the US, Edibles are a companion purchase to inhalables, so the typical buyer is an inhalable shopper adding a smokeless option. In Canada, Edibles pair with Pre-Rolls and Beverages, and baskets lean toward non-smokable products, a profile that favors placing Edibles near the cold case rather than the vape wall.
The retail implication is direct. In the US, merchandise Edibles where the inhalable shopper already stands, at the counter and beside Vapor Pens, and use bundles to pull the category back into baskets it has been falling out of. In Canada, pair Edibles with Beverages and Pre-Rolls, the formats those shoppers already buy together.
Pricing
Market Pricing
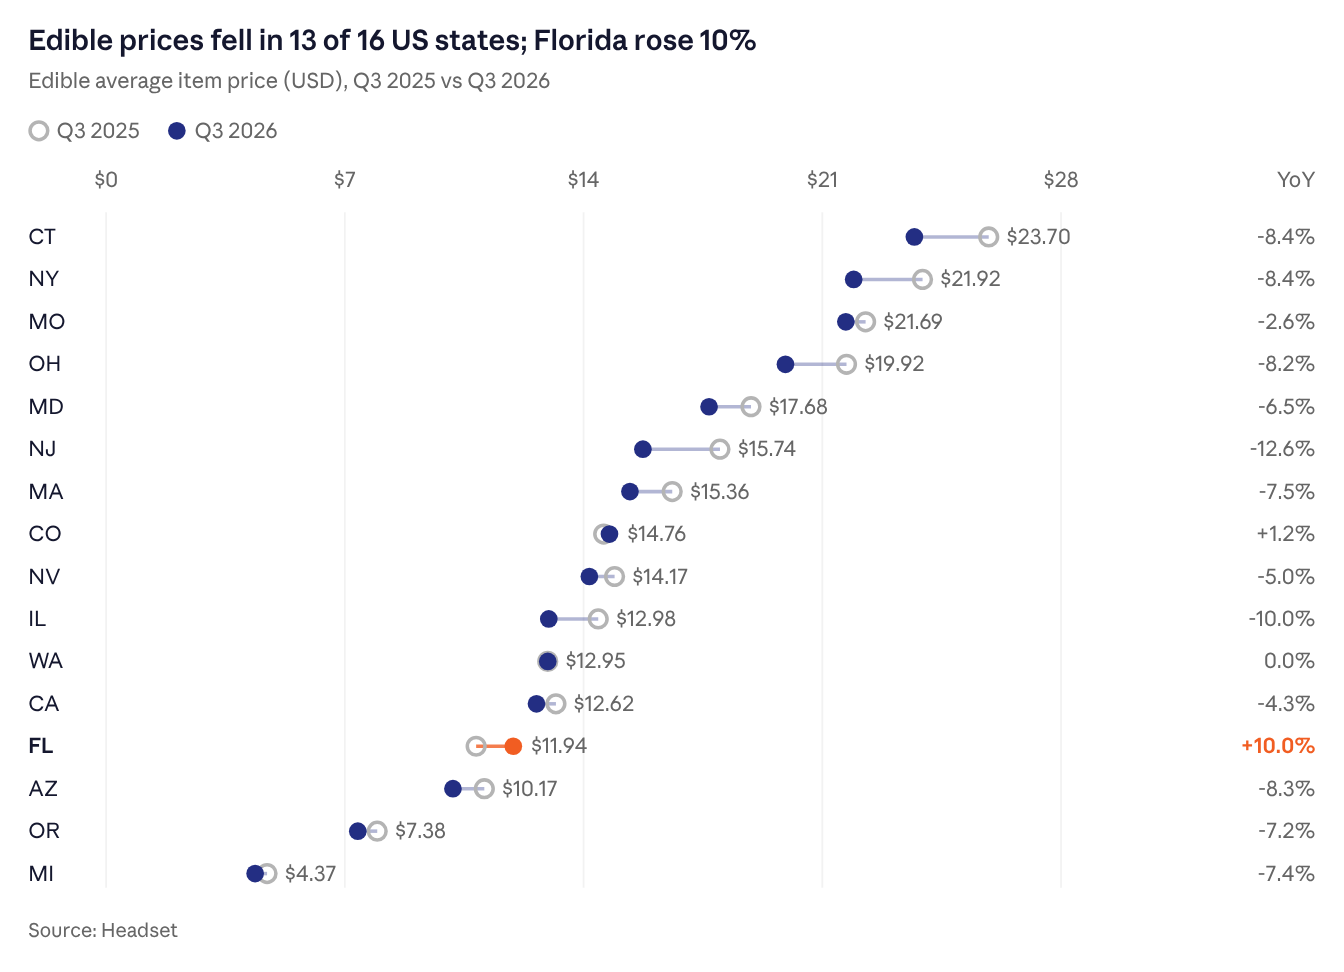
US Edible pricing varies widely by state. Michigan sits at the floor, where low-dose packs sell for a few dollars, while Connecticut, New York, Missouri, and Ohio sit far above it, reflecting newer or supply-constrained markets and, in Missouri and Ohio, larger packs.
Prices fell in 13 of 16 states, led by New Jersey and Illinois. Only Florida and Colorado rose, and Washington held flat, so the pressure is broad rather than local.
Canadian Edible prices rose sharply in every province. This is mix, not inflation: shoppers are buying bigger packs as a result of changes in package size regulation.
Pricing Over Time
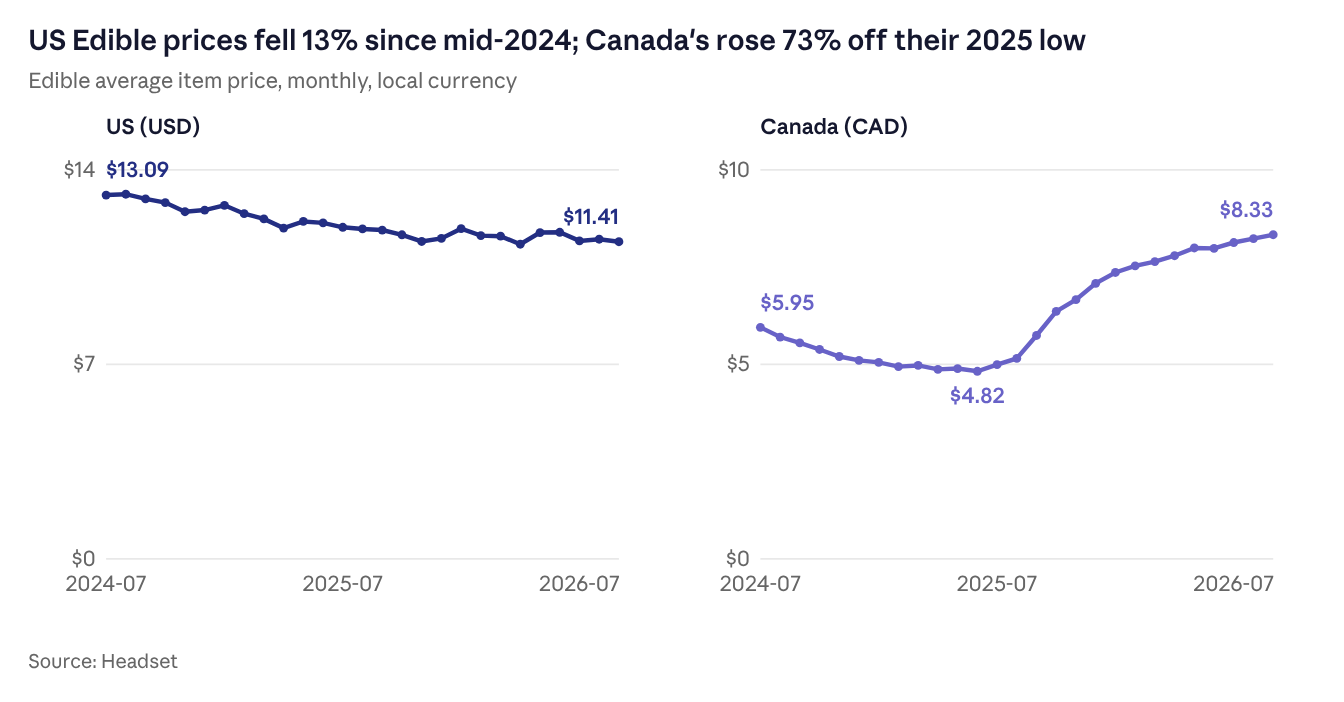
US Edible pricing is compressing, and it is among the steepest declines in the market. Over two years, average Edible item price fell about 12%, in line with Beverages and well ahead of Pre-Rolls (down 8%), Flower (6%), and Vapor Pens (3%), while Concentrates held and Topicals and Capsules rose. Unlike Beverages, no dose shift is driving it: the 100mg pack dominates throughout, so the decline reflects like-for-like price pressure as brands compete for a flat pool of dollars. The pace has slowed, with prices roughly level near $11.50 since late 2025, which suggests a floor is forming. Even so, Edible pricing remains less stable than Concentrates and Vapor Pens, where prices have barely moved.
In Canada, average item price dipped through mid-2025, then climbed as co-packs took over the shelf. For Canadian retailers, Edibles have quietly become a higher-ticket category, which changes how much shelf space and staff attention they warrant.
Demographics
Age Group
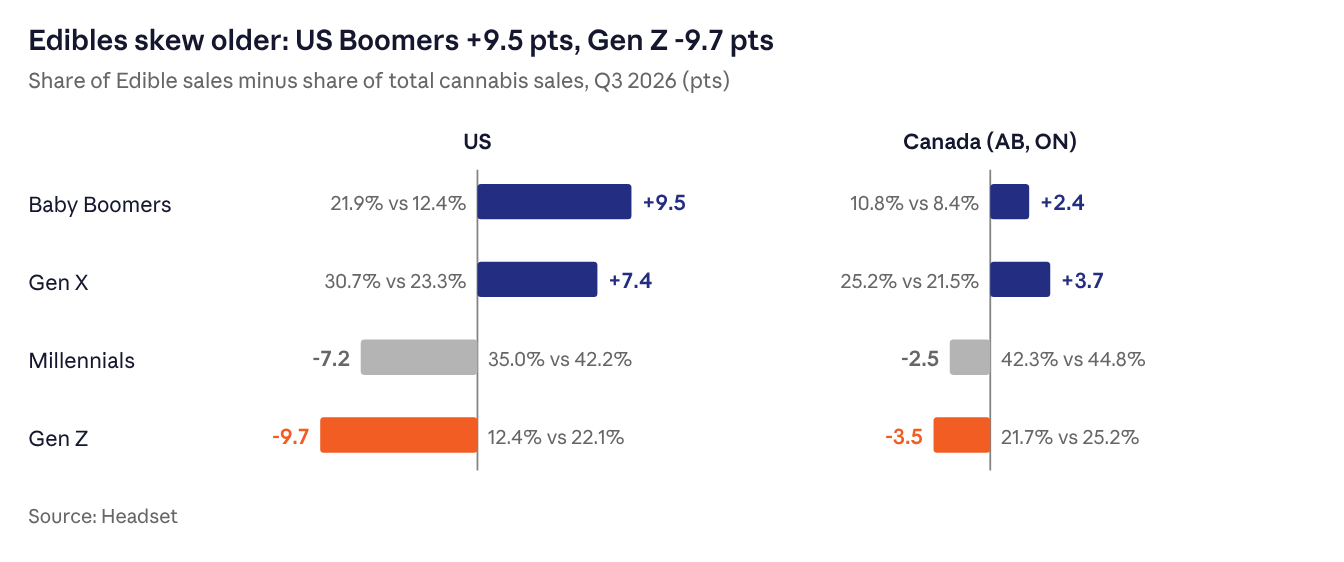
In the US, Edibles skew older than the cannabis market as a whole. Baby Boomers account for 21.9% of Edible sales against 12.4% of total cannabis sales, a 9.5-point over-index, and Gen X adds 7.4 points (30.7% vs 23.3%). Together, the two oldest generations buy more than half of all US Edibles while making up barely a third of cannabis sales overall. Millennials under-index by 7 points, and Gen Z by nearly 10 (12.4% vs 22.1%).
In Canada, Edibles also over-index with older shoppers: Boomers +2.4 points, Gen X +3.7, Millennials -2.5, and Gen Z -3.5. The encouraging signal is that Gen Z is narrowing the gap, with Edibles taking a larger share of Gen Z cannabis spend YoY for both men and women. A category built on sleep, relief, and predictability resonates most with consumers who value those things. That is a solid base for today's business and an open question for the category's next decade.
Gender
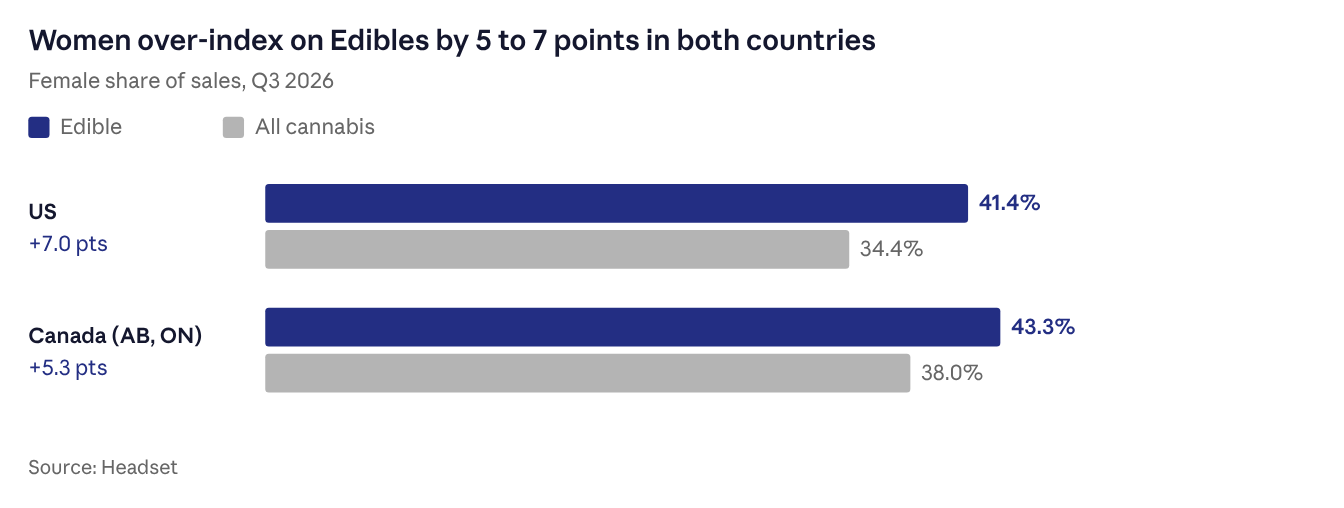
Edibles carry one of the clearest gender signatures in cannabis. In the US, women account for 41.4% of Edible sales versus 34.4% of the overall market, a 7-point over-index, and among US Baby Boomer women, Edibles take 23 cents of every cannabis dollar. In Canada, women account for 43.3% of Edible sales versus a 38% baseline. For brands setting creative, packaging, and retail strategy, the older female shopper is the category's most durable demographic asset and the one most aligned with outcome-based formulations.
Conclusion
In Q3 2026, Edibles are telling two different stories. In the US, the category is mature: it keeps its loyal buyers and its place on the shelf, but faster-moving inhalables are capturing the new dollars, prices have compressed, and fewer shoppers add an Edible to the basket. In Canada, a single change in packaging rules reshaped the shelf, as co-packs turned a small, low-priced category into a growing, higher-ticket one.
Function runs through both markets. Shoppers are reaching for Edibles built around an outcome, from sleep to the newer cannabinoids, and blends are growing while standard THC products fade. The Edible shopper skews older and more female than the rest of the dispensary, a customer inhalables often miss, and the category peaks around holidays and gifting. What has not materialized in the US is new demand, as younger shoppers remain underrepresented.
The takeaways differ by audience. Brands should lead with the outcome and build function into core lines, and in Canada make co-packs standard. Retailers should merchandise Edibles where the inhalable shopper already stands in the US and beside Beverages in Canada, and plan the year around the winter holidays. Investors should watch the coming holiday season: a weak December would point to structural softness, and growth would then have to come from formulation and format rather than more shoppers. Edibles will not be the fastest-growing category, but they hold a customer and an occasion that nothing else in the store owns, and that position is worth defending.
