Geographical Insights into Missouri's Thriving Cannabis Market

Introduction
Missouri, is a state of over six million people and home to two large urban metros in St. Louis and Kansas City. In February of 2023 the Show Me state launched their own recreational cannabis market and quickly became one of the most lucrative markets in the region and country. With significant urban, suburban, and rural population, as well as a shared border with eight different states, the geography of Missouri is unique. Here at Headset we dug into the data to provide some insight into how these sub regions differ and how they relate to the direction of the maturing Missouri market. Together we will take a look at the urban, suburban, and rural divide and assess the different market patterns of St. Louis and Kansas City while also seeing the effect the region has on border towns in the state.
Methodology
Data for this report comes from real-time sales reporting by participating cannabis retailers via their point-of-sale systems, which are linked up with Headset’s business intelligence software. Headset’s real-time data is very reliable, as it comes digitally directly from our partner retailers. However, the potential does exist for misreporting in the instance of duplicates, incorrectly classified products, inaccurate entry of products into point-of-sale systems, or even simple human error at the point of purchase. Thus, there is a slight margin of error to consider. In this report, we examine sales from our Missouri dataset which captures approximately 80% of stores and sales in the state creating a very accurate picture in the market. Our categorization methods in this analysis were based on the US census “urbanized areas” and generally classify stand alone Missouri cities with a population over 50,000 as urban, surrounding areas as suburban, and smaller isolated townships as rural.
Key Takeaways
- Typical daily sales across urban, suburban, and rural retailers all hover around the median total of $14,652.
- Kansas City has a typical daily sales value that is 73% higher than St. Louis which see lower daily sales likely due to their geographical position near Illinois.
- A lack of recreational markets in the region benefits Missouri’s market, particularly in border towns which in some cases see some of the highest sales totals in the entire state.
- Average basket size has gone down and item per basket has gone up across the state. This is a result of a maturing market that has seen a decrease in prices and an increase in competition.
- Rural retailers have the highest average basket size and have seen it shrink less than the market average. They also boast the highest average items per basket compared to urban and suburban retailers.
- With a higher portion of customers over 42, rural retailers have proven stronger than average basket metrics and resilience to evolving market conditions.
- St. Louis retailers have seen their average basket size sink 17% year over year totaling around $50 in May 2024. This is 22% lower than in Kansas City whose average basket more closely resembles the state average.
- Discounting across the state has risen dramatically the last year up from an average rate of 9% to 16% putting it inline with rates seen at the national level.
- Want to see how your dispensary stacks up? Try out our new Retailer Benchmarking report.
Sales
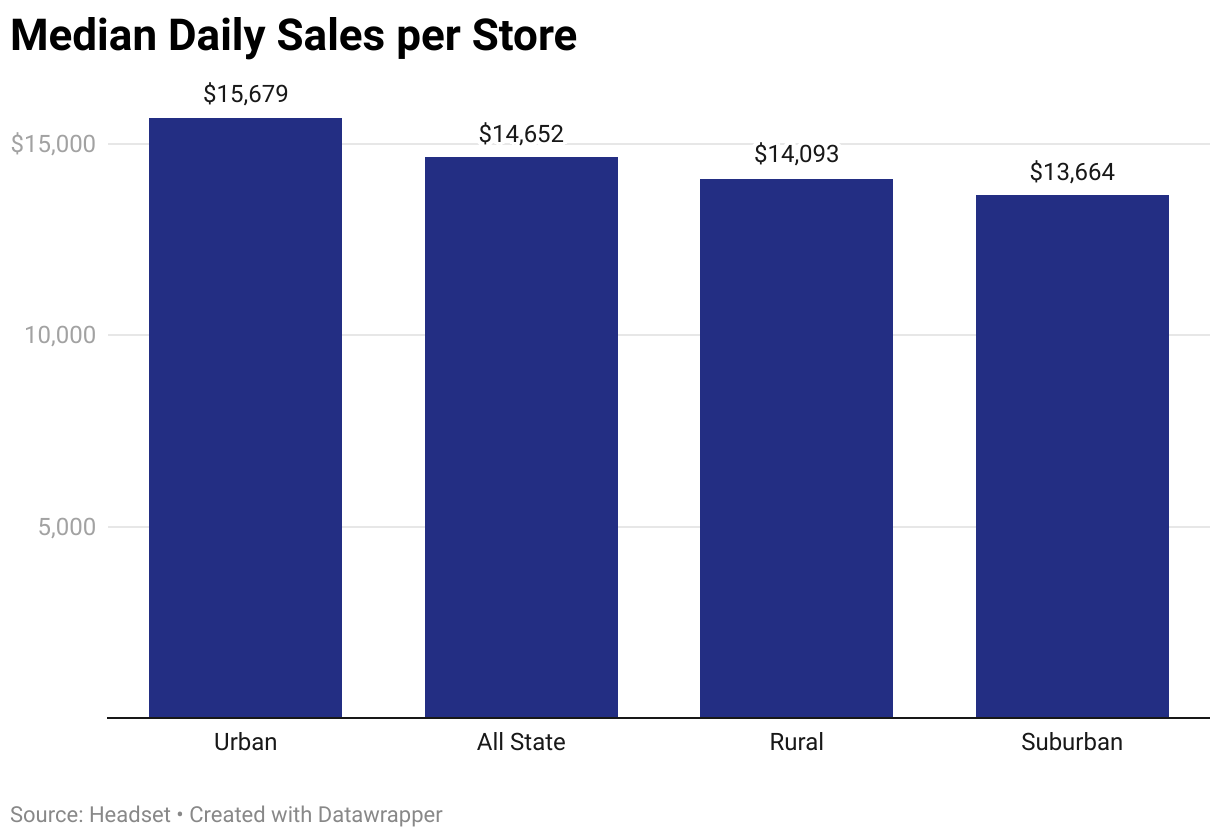
It may come as a surprise that urban, suburban, and rural cannabis retailers all have daily sales that hover around the state median of $14,652. This shows that a store in Rolla Missouri can capture business rivaling that of retailers in Kansas City or St. Louis.
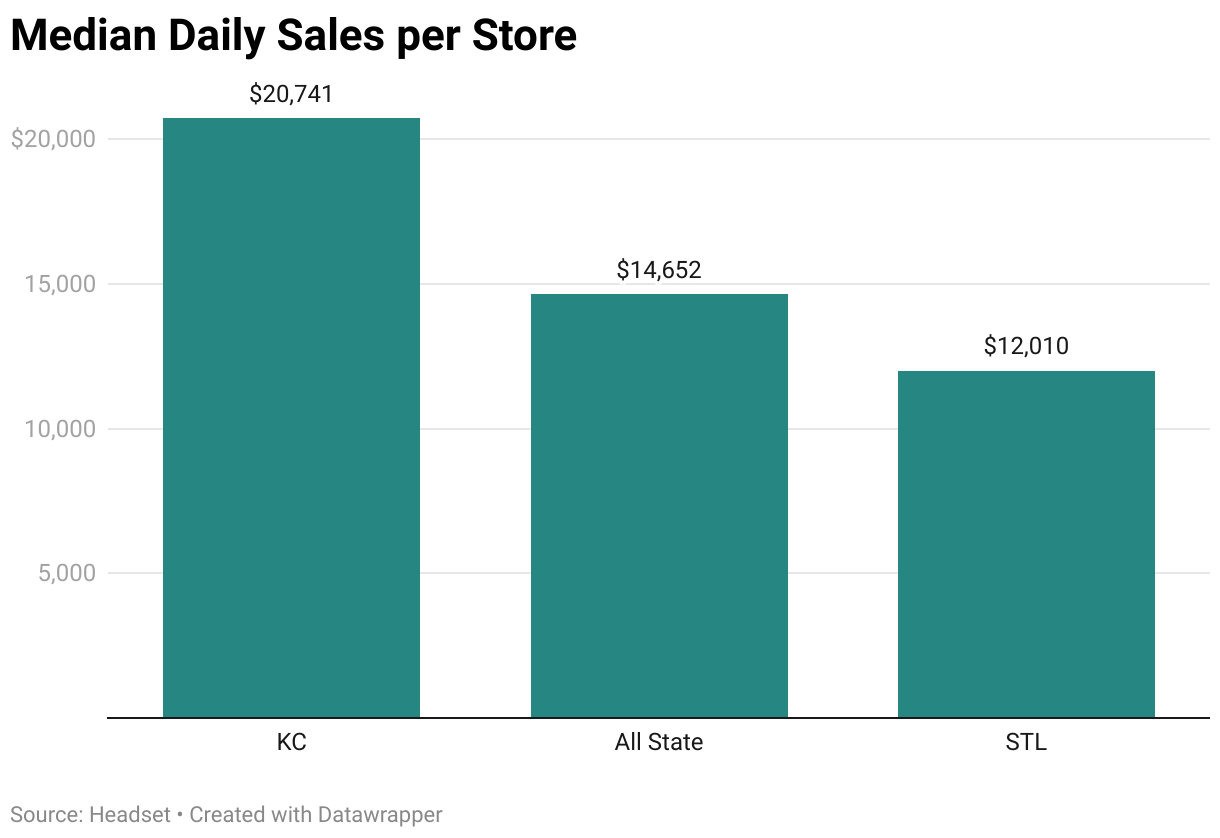
However, while the wealth is spread fairly even across rural and urban environments there are advantages that Kansas City retailers experience compared to those in its cross state counterpart St. Louis. Though similar size cities, the Kansas City retailers median daily sales is 73% higher than in St. Louis at $20,741 and 12,010 respectively. Curiously this St. Louis figure is notably lower than the all state median. What could be contributing to this?
.png)
Geographical elements play a significant role in the Missouri cannabis market. Missouri, along with Tennessee, shares a border with eight other U.S. states, the most of any state in the country. Across the data we can see very strong performance of stores located along the borders. Seven of the eight states bordering Missouri do not have legal recreational cannabis markets, putting Missouri in the position of regional supplier. While the Kansas City metro encompasses a large swath of Kansas whose residents surely are patrons of KCMO retailers, St. Louis shares their border with Illinois who is the only other legal adult use market bordering Missouri. So not only does St. Louis miss out on the opportunity to cash in on out of state demand but inversely are forced to compete with cross border retailers.
While a variety of regions in Missouri benefit from out of state demand, this won’t always last and stores should be building strong retail business that can get the most out of their local markets.
Basket Analysis
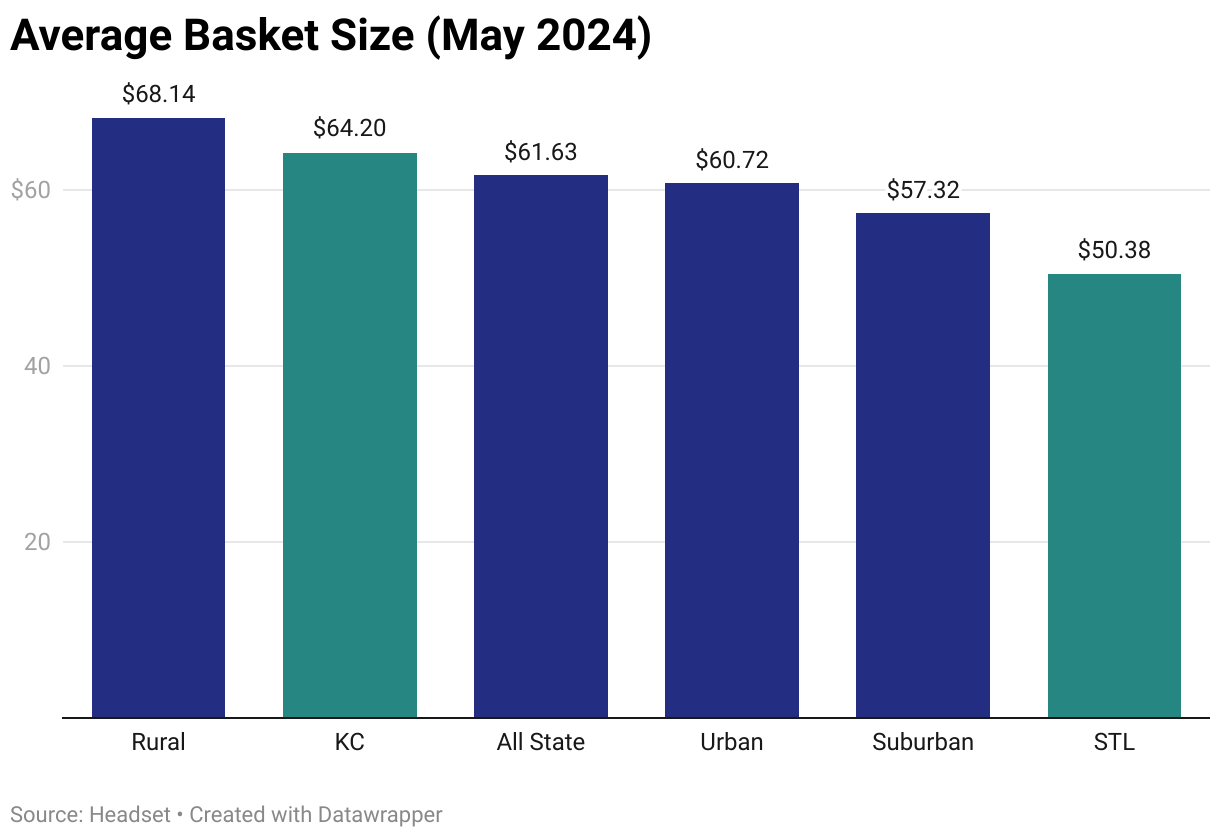
Across our geographical segments urban, suburban, and rural basket metrics look quite uniform. However, we find more evidence of market variation between St. Louis and Kansas City. In May 2024 Kansas City had an average basket size of $64.20, which resembles the all state average of $61.63. St. Louis retailers on the other hand see an average basket size of $50.38 22% less than that of KC. Both cities see approximately 2.2 items per basket. However, St. Louis's lower basket size is affected by an higher average discount rate of 20%, compared to 15% in Kansas City. Additionally, the average item price in St. Louis is 19% lower than in Kansas City. These market elements all flow into the markedly lower average store sales we saw earlier between the two cities. Some causes might be geographic like the previously mentioned proximity to the Illinois market in St Louis or perhaps influenced by economic conditions such as the 23.3% disparity between median household income between the two markets providing consumers with different amounts of disposable income.
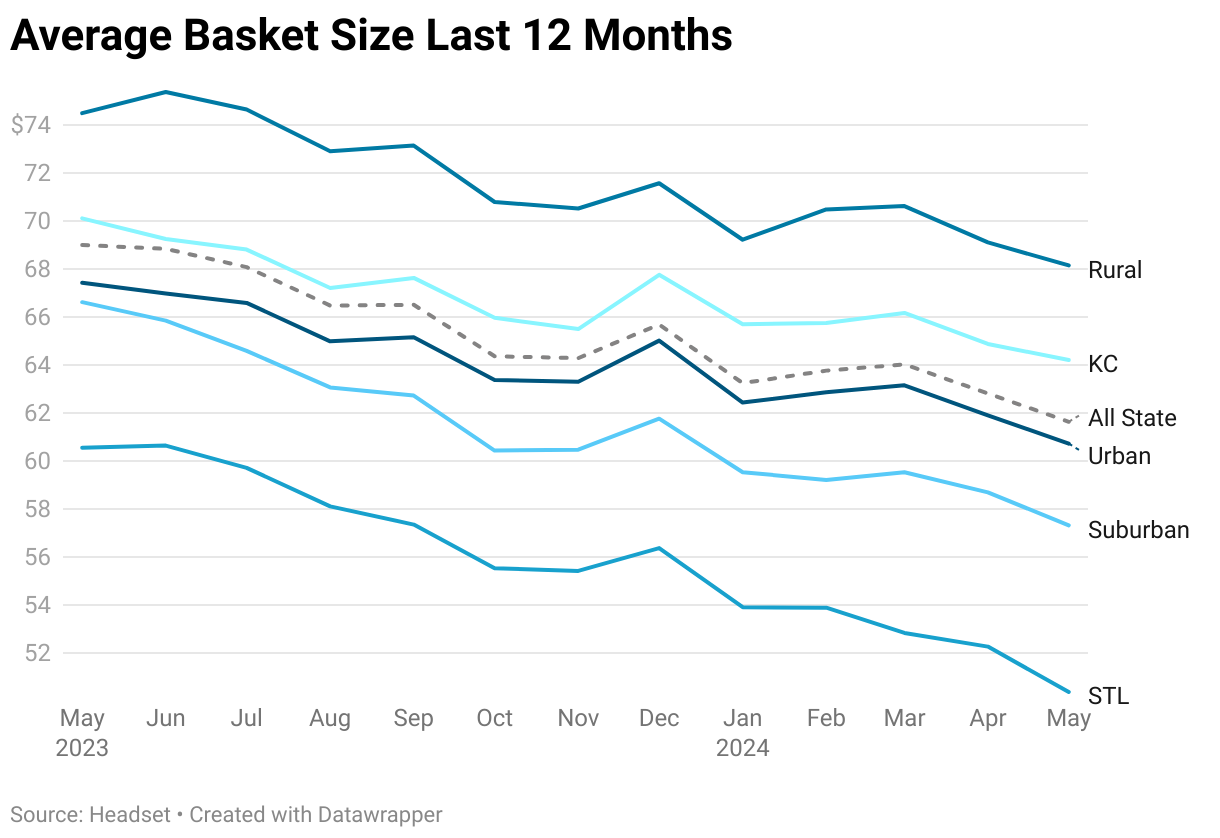
Average basket size is decreasing across Missouri seeing a 10.7% reduction as of May 2024 compared to the previous year. As a maturing market this was an anticipated trend, the launch of Missouri’s recreational cannabis market last year saw high starting prices and very strong demand. However, as the market develops prices come down and competition increases.
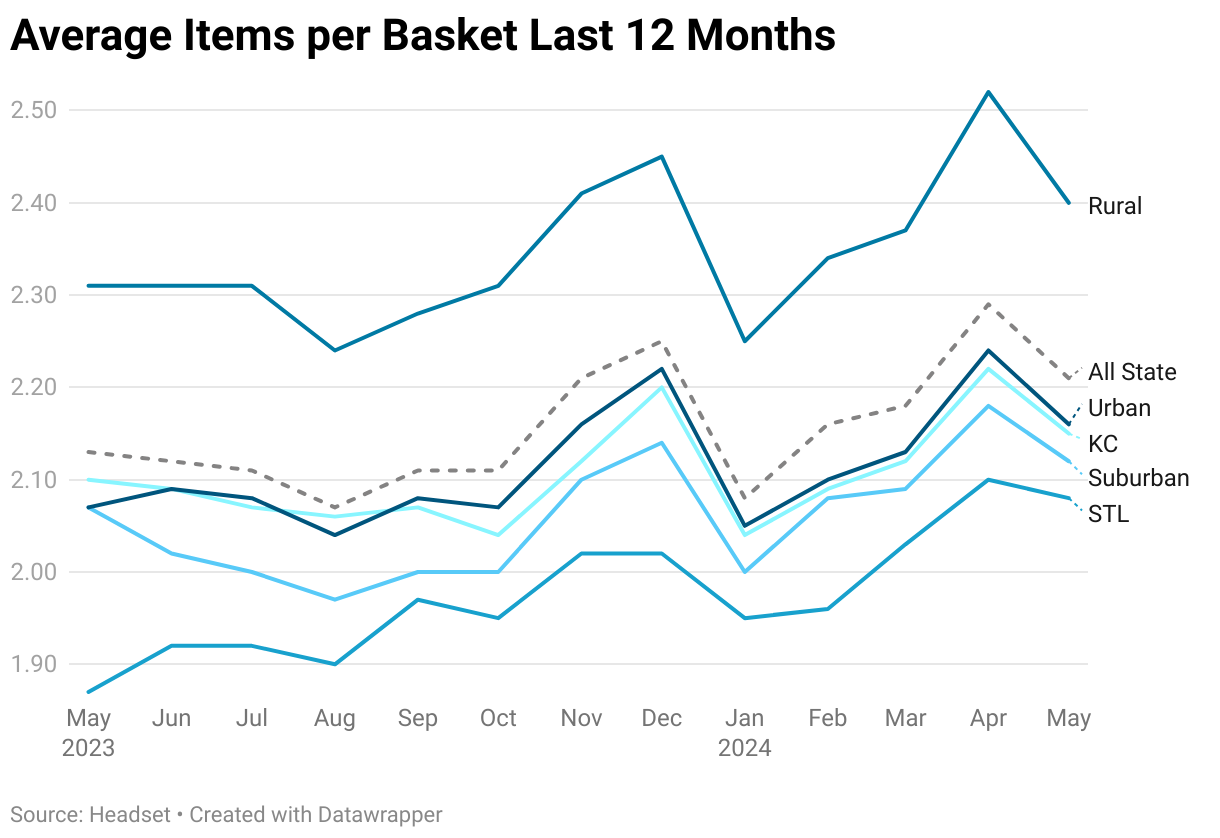
One way for retailers compensate is by increasing the items per basket which has increased 3.7% over the same period as well utilizing techniques such as discounting to drive more traffic to their stores. Discounting has shot up 82% in the last year to meet national levels at an average rate of 16% compared to 9% the year prior.
There are noticeable geographical trends in this data. Understandably competition has intensified in urban areas more quickly than for rural retailers. Rural retailers have the highest average basket size of any sub region at $68.14 and has seen this metric shrink the least in the last year. This likely could be attributed to their higher than average items per basket which is 2.4 compared to the all state average of 2.2. Additionally rural retailers have seen this metric grow at a faster rate than the all state average.
Pricing
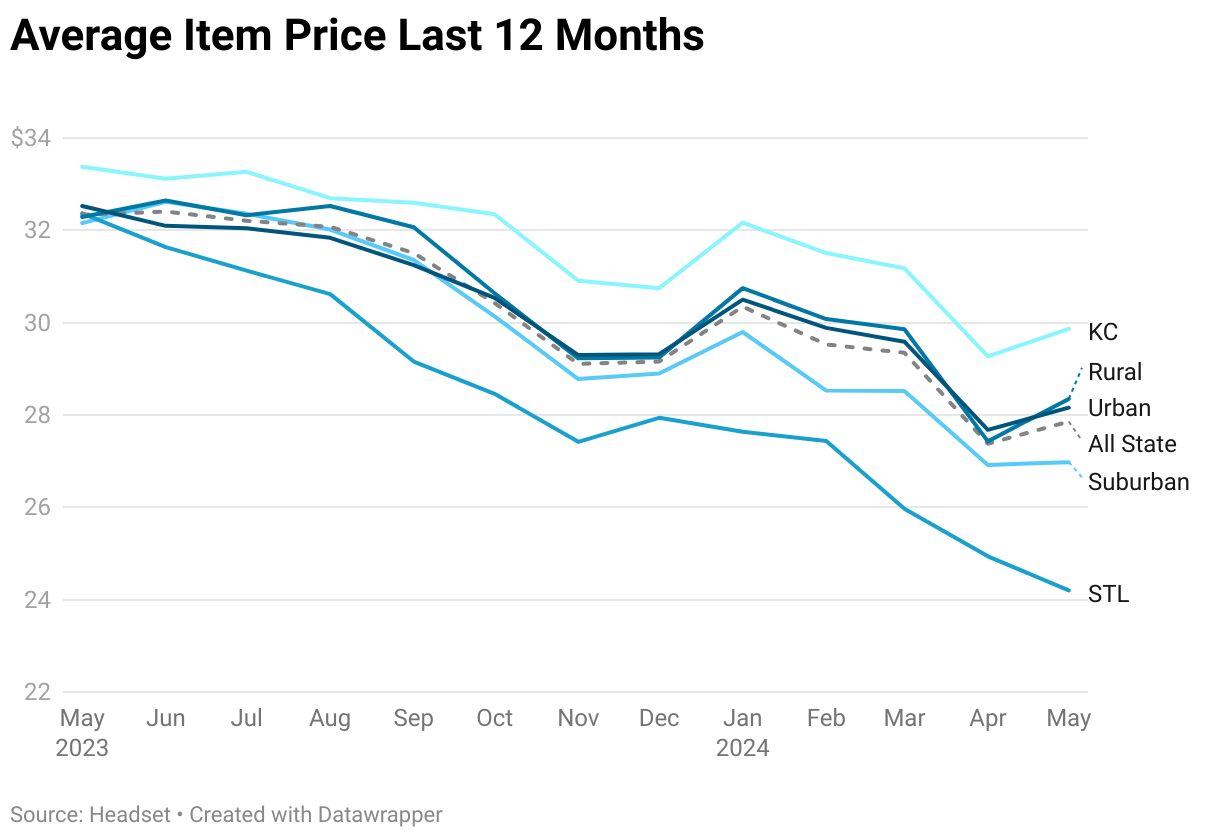
Prices are falling across the state as expected. In the days after market launch Missouri had some of the highest prices in the country but as the market has matured and additional states have launched their own markets, Missouri’s prices have steadily drifted towards that of a more mature industry.
In the last year average item price (AIP) fell 14%. This reduction in prices was the heaviest in St. Louis which saw a decrease of 25% while Kansas City matched the state average. Despite having a longer standing recreational market, Illinois across the river from St. Louis, has notably higher prices. The heavier discounting, lower prices, and dramatic changes in basket metrics could likely be the effects of competition and an effort by STL retailers to undercut their cross border competition.
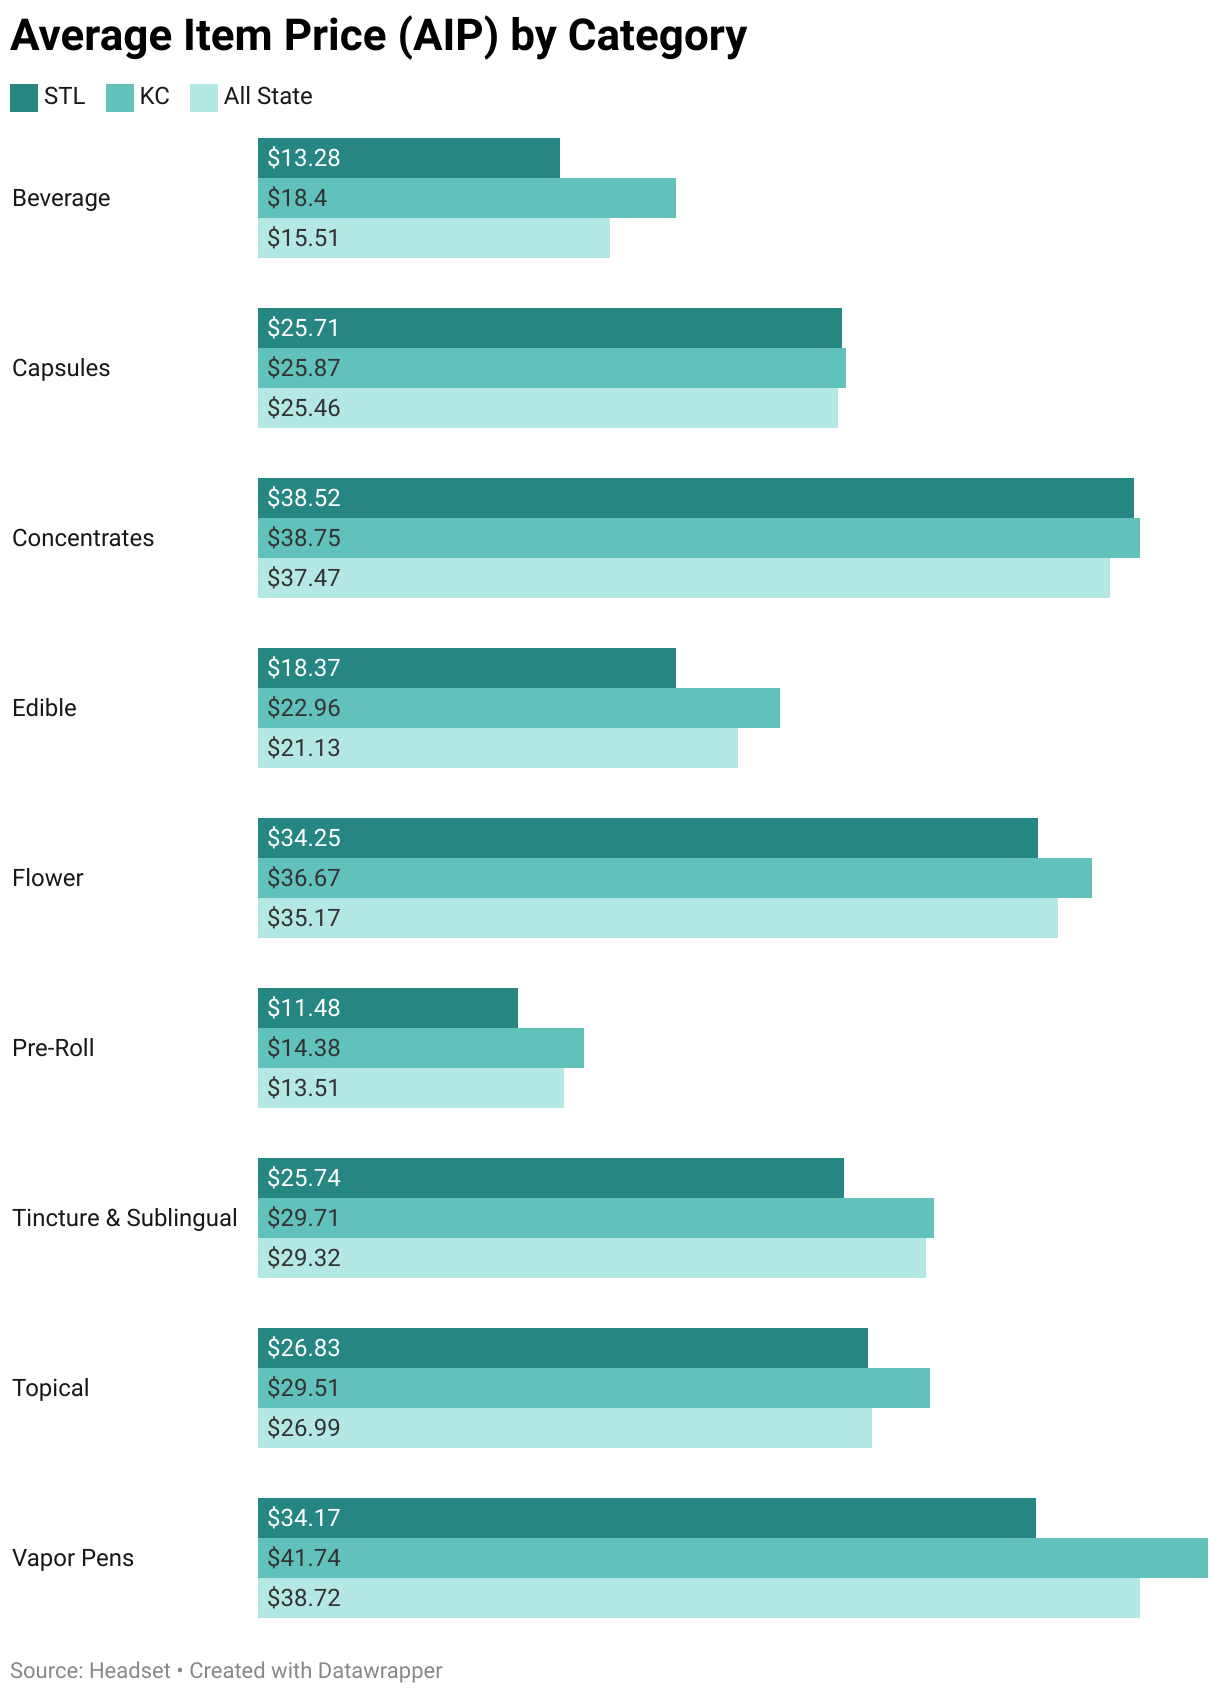
St. Louis has significantly lower prices in key categories such as Pre-Rolls, Edibles, Vapor Pens which are 15%, 13%, and 12% lower than the rest of the state. By comparison KC’s average item prices more closely reflect state averages.
Consumer Demographics
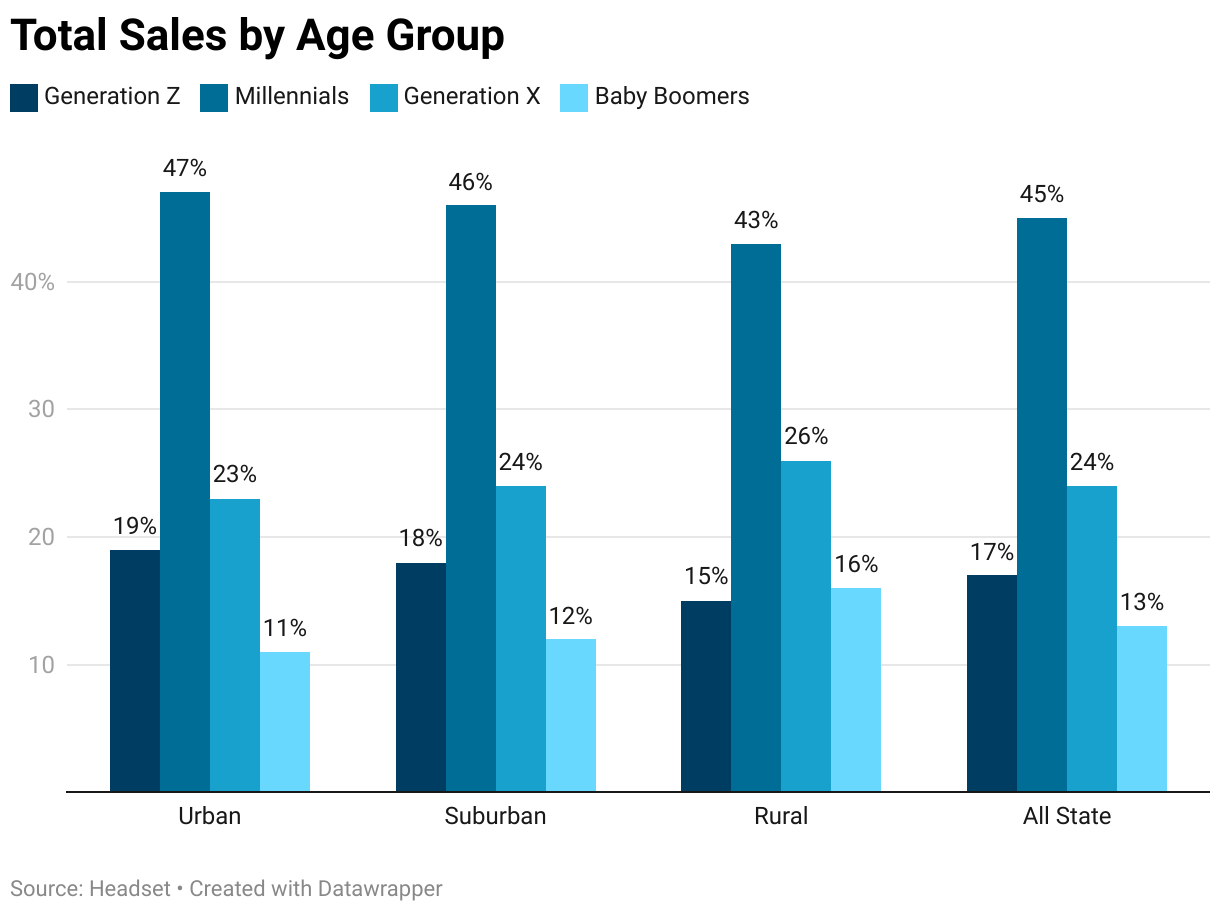
Demographically the sales breakdown by customers looks similar to the rest of the country with men generating about two thirds of total sales with nearly a much coming from the Millennial and Gen Z age groups. However, when we segment by sub region to no surprise we see a larger portion of older customers shopping at rural retailers compared to urban or suburban stores. At rural stores, customers 43 and over capture 42% of total sales compared to 34% at urban stores.
This would explain the strong position that we’ve seen from rural stores across the state with relatively high average basket sizes and items per basket. Gen X and Boomers over 42 have an average basket size of nearly $75 with 2.4 average items per basket compared to customers 21-42 spending $63 on 2.1 item respectively. Older consumers have more disposable income, and as a larger portion of rural customers, retailers get to enjoy the extra disposable income as well.
Conclusion
Missouri’s cannabis market has developed a lot in the last year. With stores all around the state there is lots of geographical nuance to doing business. Missouri is currently benefiting from its many shared borders and advantage as one of very few recreational markets in its region. Kansas City benefits from having a metro on the border with a cannabis deprived Kansas, while St. Louis retailers see themselves in a competitive battle with a nearly five year old Illinois market. Border towns shops are booming due to this effect, propping up rural and urban retailers alike. As the economics of the industry are shifting rural retailers see support from their older than average customer base. Having all the detailed geographic data helps those doing business in Missouri understand approaching storms, retail hot spots, and opportunities for further investment and expansion. As always, Headset Insights is ready to Show You what is happening in the Show Me state in real-time.


