.svg)

Sep-2026
Sales
Trend
6-Month
Product Count
SKUs
Avg Price
YoY Sales Change
YoY Price Change


Market Insights Snapshot
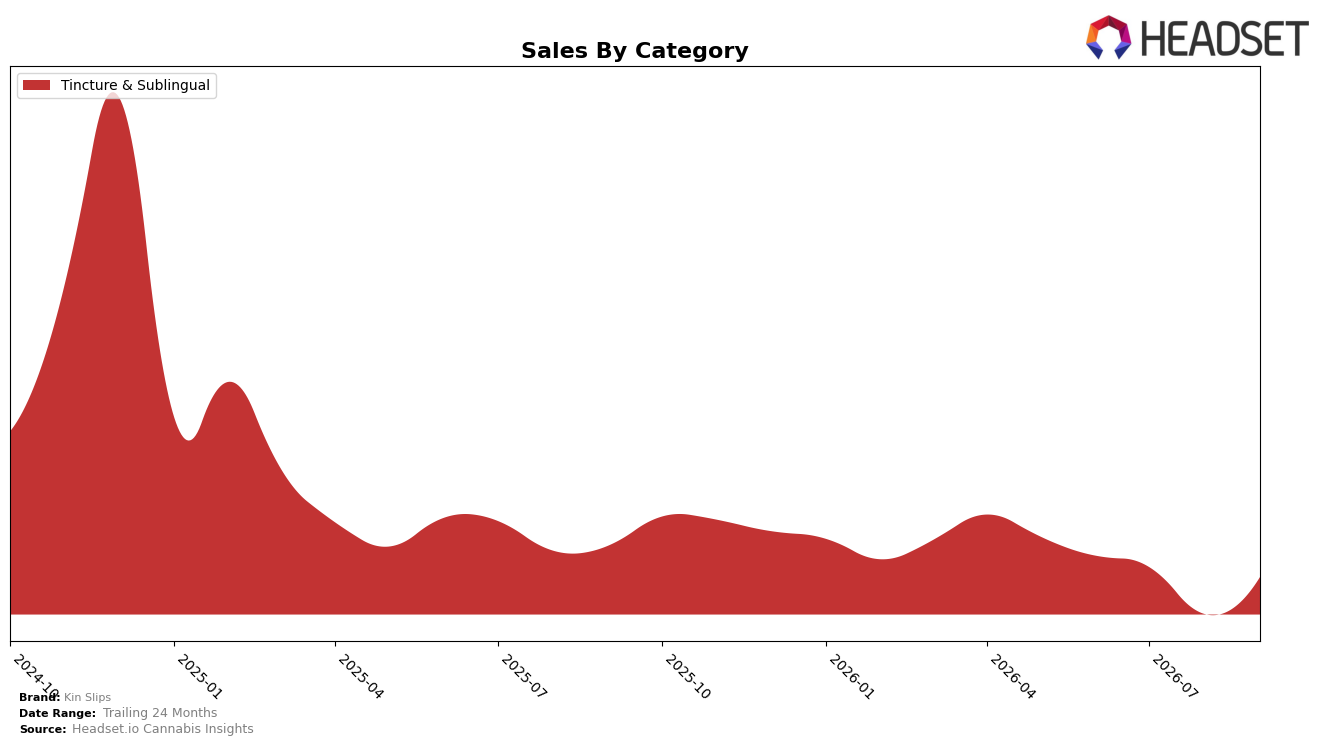
In September 2026, Kin Slips operated as a single-category brand in Tincture & Sublingual with a 100.0% mix, posting a 42.62% month-over-month sales rise alongside a -20.19% year-over-year decline; the category rank in Ontario stood at 1 while average price fell -18.27% year over year to $20.08. The combination of a top-ranked position and full-category concentration implies Kin Slips is leaning on a lower-price, volume-recovery tactic within Tincture & Sublingual rather than diversifying, which sets the near-term trajectory around price elasticity and in-category depth rather than breadth.
The -56.41% two-year sales change against a concurrent rank of 1 in Ontario and a -18.27% average price shift suggests a price-led repositioning that lifted September 2026 volumes enough to drive a 42.62% month-over-month rebound but not enough to repair the -20.19% year-over-year gap. This pattern implies Kin Slips’s positioning is anchored to value within Tincture & Sublingual—prioritizing share defense and unit throughput at the expense of premium pricing—and future upside depends on whether September’s volume elasticity can sustain without further price compression.
Competitive Landscape
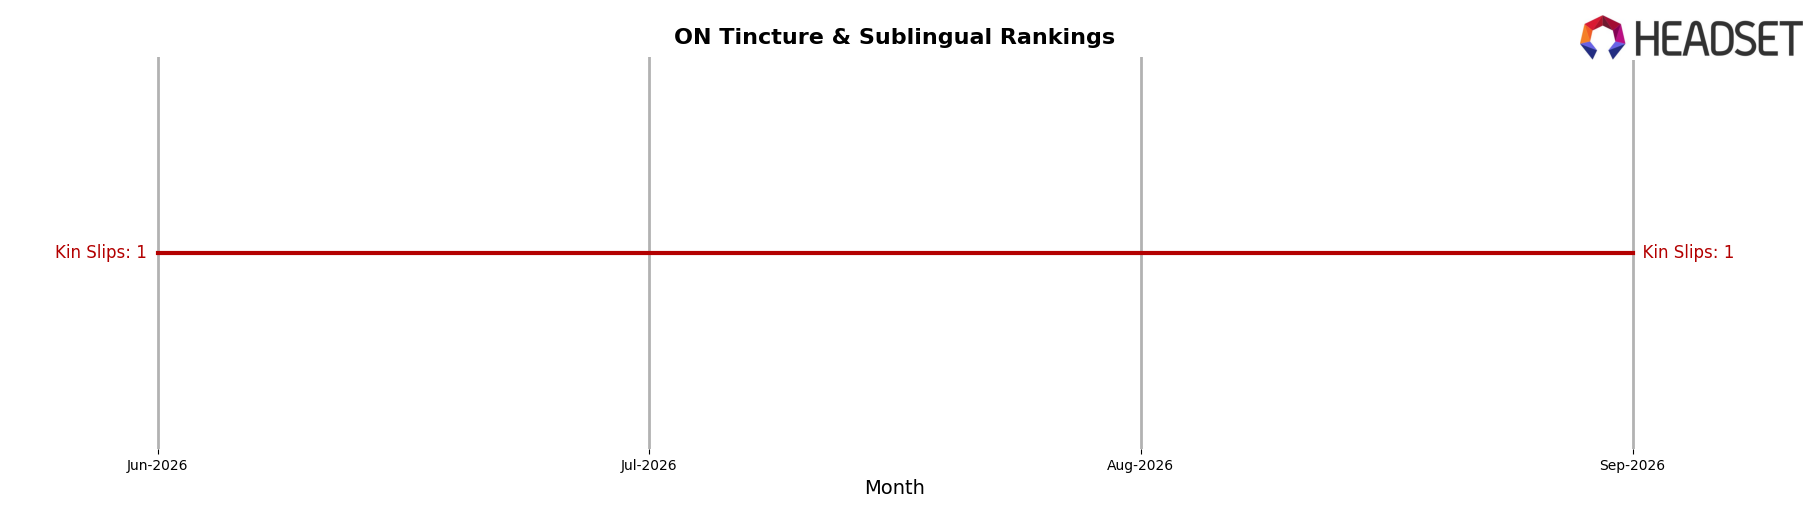
Kin Slips holds rank #1 in ON Tincture & Sublingual in September 2026, unchanged from rank #1 in September 2025, and it also maintained rank #1 across the last 3 months while peaking at rank #1 in September 2026; the absence of any listed top_competitors suggests either a consolidated leaderboard or incomplete visibility, which contrasts with typical category dynamics where a #2 or #3 would show quarter-over-quarter churn. With 0 positions of rank movement year over year and 0 positions of change since June 2026, the pattern implies durable category control driven by stability rather than recent share capture, meaning future shifts are more likely to come from external entrants than from intra-tier reshuffling.
Notable Products
Float On Balance & Tranquility Sublingual Strip 10-Pack (100mg) posted the sharpest movement in September 2026 with an 88.5% month-over-month increase and rose to rank 2, while Cloud Buster Sublingual Strip 10-Pack (100mg) grew 36.2% MoM and held rank 1. Both top SKUs sit in Tincture & Sublingual, and with two of the top two positions occupied by sublingual strips and a combined share of the top-2 ranks, the portfolio is consolidating around fast-rising functional formats rather than breadth. The $21,664 in September 2026 sales from Cloud Buster alongside Float On’s surge implies momentum is concentrated in a narrow set of hero strips, signaling a strategy that prioritizes depth in leading sublingual offerings over expanding into adjacent categories.
Top Selling Cannabis Brands






Data for this report comes from real-time sales reporting by participating cannabis retailers via their point-of-sale systems, which are linked up with Headset’s business intelligence software. Headset’s data is very reliable, as it comes digitally direct from our partner retailers. However, the potential does exist for misreporting in the instance of duplicates, incorrectly classified products, inaccurate entry of products into point-of-sale systems, or even simple human error at the point of purchase. Thus, there is a slight margin of error to consider. Brands listed on this page are ranked in the top twenty within the market and product category by total retail sales volume.

