.svg)

Sep-2026
Sales
Trend
6-Month
Product Count
SKUs
Avg Price
YoY Sales Change
YoY Price Change


Where to Buy
Wyld is stocked at 3,720 licensed dispensaries across California, Michigan, and 21 other states, 658 of them in California, with the deepest coverage in Los Angeles, Sacramento, San Francisco, San Diego, and Santa Ana. Search by ZIP code or city below to find the closest one, or filter by product type if you are after a specific format.
Market Insights Snapshot
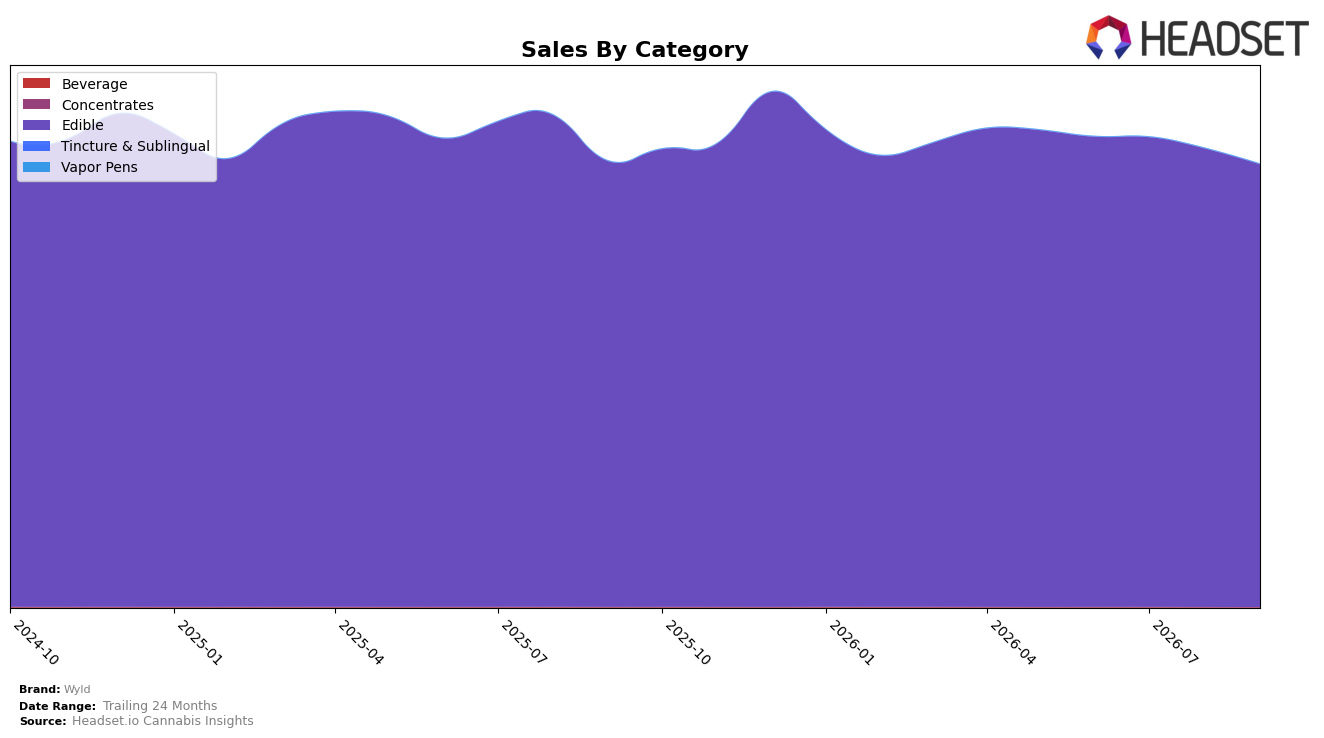
Edible dominated Wyld’s mix in September 2026 at 99.97% share, with year-over-year sales down 67.78% and month-over-month down 3.46%, while average price rose 6.96% year over year to $14.85. The micro-mix at the edges moved in opposite directions: Beverage held 0.03% share with a 45.66% YoY decline and an 18.73% MoM drop, whereas Tincture & Sublingual sat at 0.00% share but spiked 201.01% MoM despite a 43.90% YoY decline. With Arizona Edible rank at 1 and CA as the top state, the pattern implies a brand anchored almost entirely in Edibles, absorbing price-led contraction while peripheral formats remain too small to offset category-level volume pressure.
The mix shift signals concentration risk and pricing elasticity: a 6.96% higher average price alongside a 67.18% brand-level YoY sales decline and a 3.46% Edible MoM dip indicates demand sensitivity within the core category despite a top rank in Arizona Edibles at 1. The 201.01% MoM lift in Tincture & Sublingual from a 0.00% share base and the 18.73% MoM fall in Beverage at 0.03% share suggest experiments outside Edibles are not yet material; the implication is that near-term positioning relies on defending Edible share and moderating price-driven attrition rather than expecting diversification to contribute meaningfully in the next few months.
Competitive Landscape
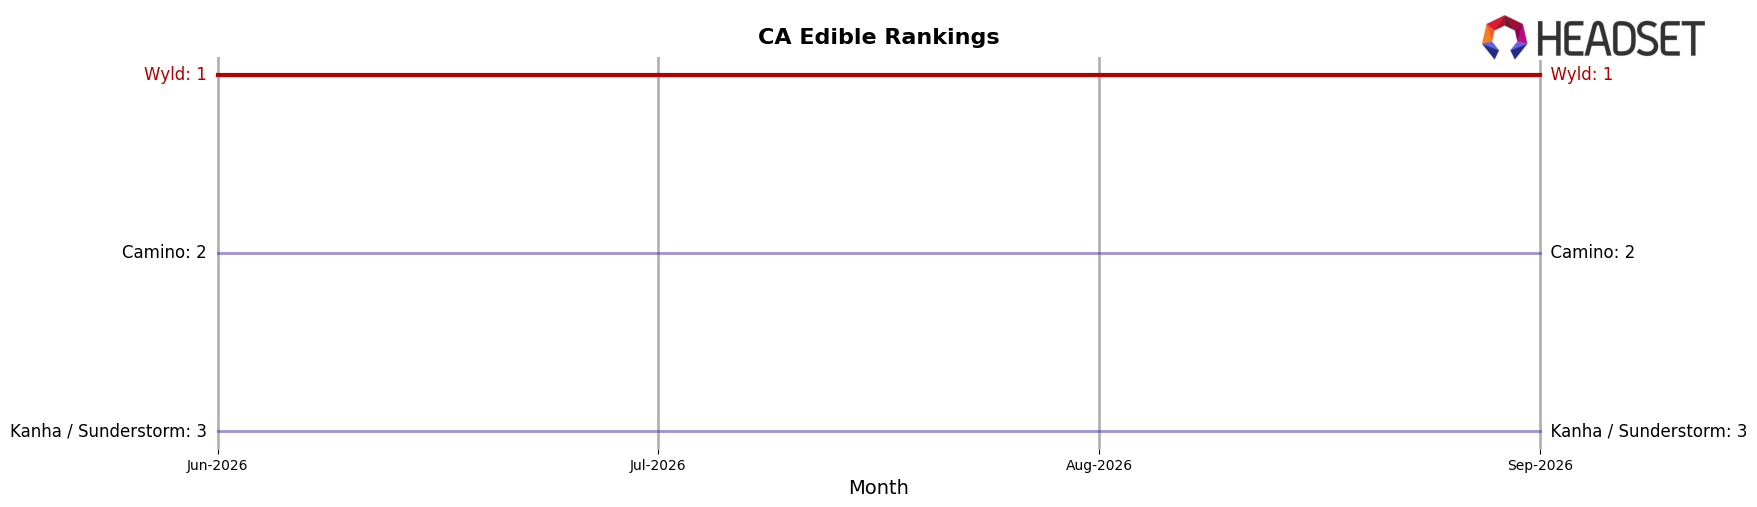
Wyld is ranked #1 in California Edible in September 2026, unchanged from #1 a year earlier, and it also held #1 three months ago, indicating zero rank movement across both the year-over-year and quarter windows; by contrast, Camino stayed at #2 while growing sales by 10.39% year over year, and Kanha / Sunderstorm remained at #3 with 11.45% YoY sales growth, while Lost Farm held #4 with a -0.56% YoY sales change; this pattern of Wyld maintaining #1 as multiple followers post double-digit growth implies the category’s chase pack is compressing the gap, so sustaining share will likely require counter-moves even without a rank decline.
Notable Products
CBD/CBN/THC 1:1:1 Indica Boysenberry Gummies 10-Pack (100mg CBD, 100mg CBN, 100mg THC) posted the steepest movement in September 2026 with a -102.4% month-over-month swing while holding rank 1, a paradox that suggests pipeline or accounting noise rather than demand erosion. By contrast, THC/CBN 2:1 Indica Elderberry Gummies 10-Pack (100mg THC, 50mg CBN) climbed at +237.0% MoM into rank 2, widening the gap over Sativa Raspberry Gummies 10-Pack (100mg) at rank 3 with a -5.9% MoM decline. With all top 10 items in Edible and nine of the top 10 showing MoM declines between -1.1% and -5.9% while one outlier surged, the mix points to portfolio reliance on sleep/relaxation formats and heightened volatility driven by formulation-led demand spikes. The pattern implies Wyld is concentrating volume in functional indica SKUs while managing exposure to sativa variants, signaling a shift toward higher-need-state gummies even as baseline turns soften.
Top Selling Cannabis Brands






Data for this report comes from real-time sales reporting by participating cannabis retailers via their point-of-sale systems, which are linked up with Headset’s business intelligence software. Headset’s data is very reliable, as it comes digitally direct from our partner retailers. However, the potential does exist for misreporting in the instance of duplicates, incorrectly classified products, inaccurate entry of products into point-of-sale systems, or even simple human error at the point of purchase. Thus, there is a slight margin of error to consider. Brands listed on this page are ranked in the top twenty within the market and product category by total retail sales volume.

