.svg)

Sep-2026
Sales
Trend
6-Month
Product Count
SKUs
Avg Price
YoY Sales Change
YoY Price Change


Where to Buy
Ozone is stocked at 387 licensed dispensaries across Illinois, New Jersey, and 6 other states, 144 of them in Illinois, with the deepest coverage in Chicago, Springfield, Normal, Quincy, and Schaumburg. Search by ZIP code or city below to find the closest one, or filter by product type if you are after a specific format.
Market Insights Snapshot
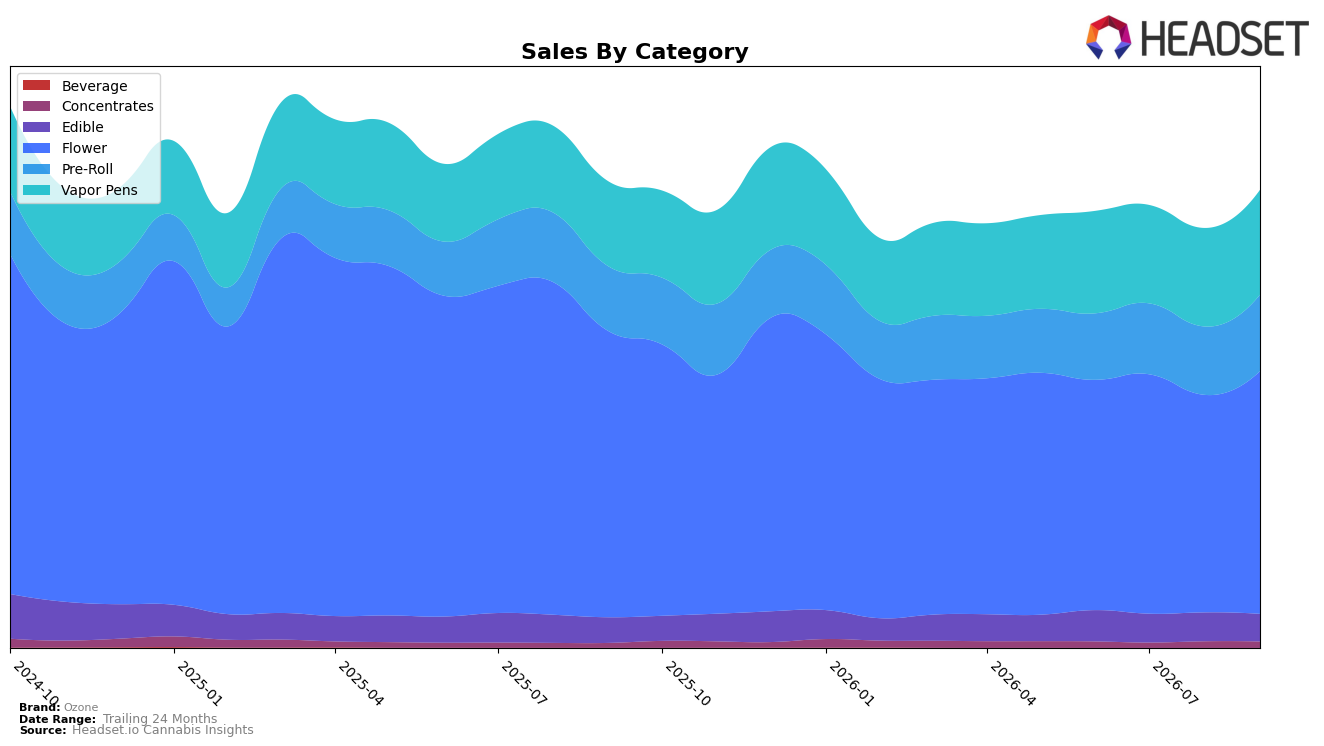
Ozone concentrated more than half of September 2026 sales in Flower at 53.11% share, where category sales fell 15.24% year over year but rose 11.61% month over month, while Vapor Pens expanded to 22.91% share on 23.52% YoY growth and 6.47% MoM growth. Pre-Roll advanced to 16.68% share with 18.11% YoY and 11.91% MoM gains, whereas Edible slipped to 5.97% share with a 7.79% YoY increase but a 4.47% MoM decline, and Concentrates held 1.33% share with 32.30% YoY growth but a 3.56% MoM dip. Despite total brand sales down 1.85% year over year and the average price down 9.76% YoY to $25.96, Ozone’s mix skew toward Flower and accelerating MoM in both Flower and Pre-Roll implies a near-term volume-led stabilization while newer gains in Vapor Pens diversify risk.
Holding rank 2 in Flower in New Jersey alongside a 11.61% MoM Flower lift and a 15.24% YoY Flower decline suggests Ozone is defending core shelf space while ceding some annual velocity, and the 23.52% YoY growth in Vapor Pens with a 6.47% MoM add indicates incremental penetration in a higher-growth format. With Pre-Roll up 18.11% YoY and 11.91% MoM as Edible contracts 4.47% MoM despite 7.79% YoY growth, the portfolio tilts toward inhalable formats that scale faster month to month; combined with a 9.76% YoY price decrease, this pattern implies Ozone is trading price for volume to reinforce Flower leadership and build a second pillar in Vapor Pens.
Competitive Landscape
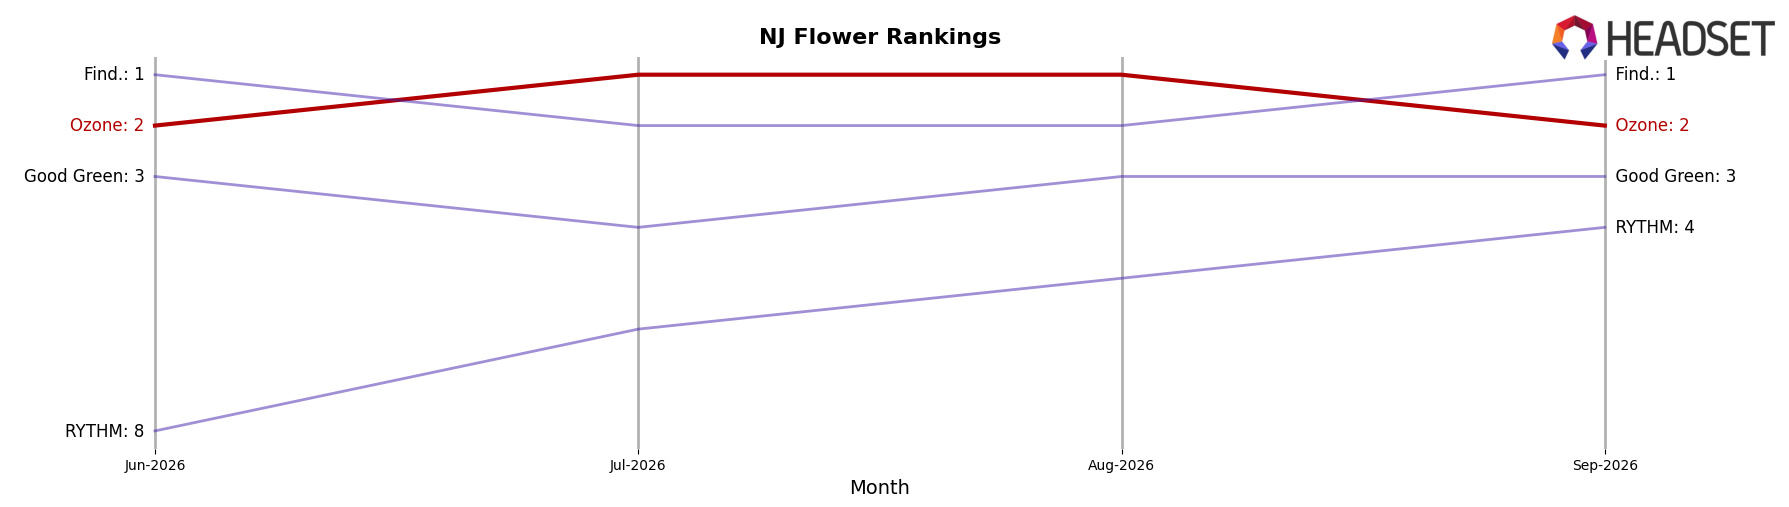
Ozone is ranked #2 in New Jersey Flower in September 2026 with a year-over-year rank change of 0 positions, holding #2 consistently for the past three months while peaking at #1 in August 2026; in contrast, Find. moved from #6 to #1 and Good Green advanced from #17 to #3 as RYTHM slipped from #3 to #4 with a -9.8% sales change year over year. The competitive spread shows triple-digit YoY growth for Find. at +111.6% and for Good Green at +166.7%, while Ozone’s flat YoY rank alongside a one-month dip from a #1 peak implies a stable share that risks gradual erosion if the current momentum gap persists.
Notable Products
Butterstuff Pre-Roll (1g) posted the steepest decline in September 2026 at -30.3% and slid to rank 8, while Happy Hour #21 Pre-Roll (1g) also contracted -23.7% at rank 10. In contrast, Butterstuff Popcorn (7g) rose +31.3% to rank 5, and Happy Hour #21 Smalls (3.5g) fell -187.8% to rank 6, implying overstock-driven discounting or distribution gaps across formats. With six of the top ten coming from Pre-Roll SKUs but the only month-over-month growth sitting in Flower, the mix implies a shift in velocity toward value-oriented Flower formats even as Pre-Roll breadth sustains shelf presence. The combined pattern suggests Ozone is leaning into heavier-weight Flower to anchor volume while trimming underperforming single Pre-Rolls.
Top Selling Cannabis Brands






Data for this report comes from real-time sales reporting by participating cannabis retailers via their point-of-sale systems, which are linked up with Headset’s business intelligence software. Headset’s data is very reliable, as it comes digitally direct from our partner retailers. However, the potential does exist for misreporting in the instance of duplicates, incorrectly classified products, inaccurate entry of products into point-of-sale systems, or even simple human error at the point of purchase. Thus, there is a slight margin of error to consider. Brands listed on this page are ranked in the top twenty within the market and product category by total retail sales volume.

