.svg)

Sep-2026
Sales
Trend
6-Month
Product Count
SKUs
Avg Price
YoY Sales Change
YoY Price Change


Where to Buy
RYTHM is stocked at 1,123 licensed dispensaries across New York, New Jersey, and 11 other states, 211 of them in New York, with the deepest coverage in New York, Queens, Brooklyn, Staten Island, and Buffalo. Search by ZIP code or city below to find the closest one, or filter by product type if you are after a specific format.
Market Insights Snapshot
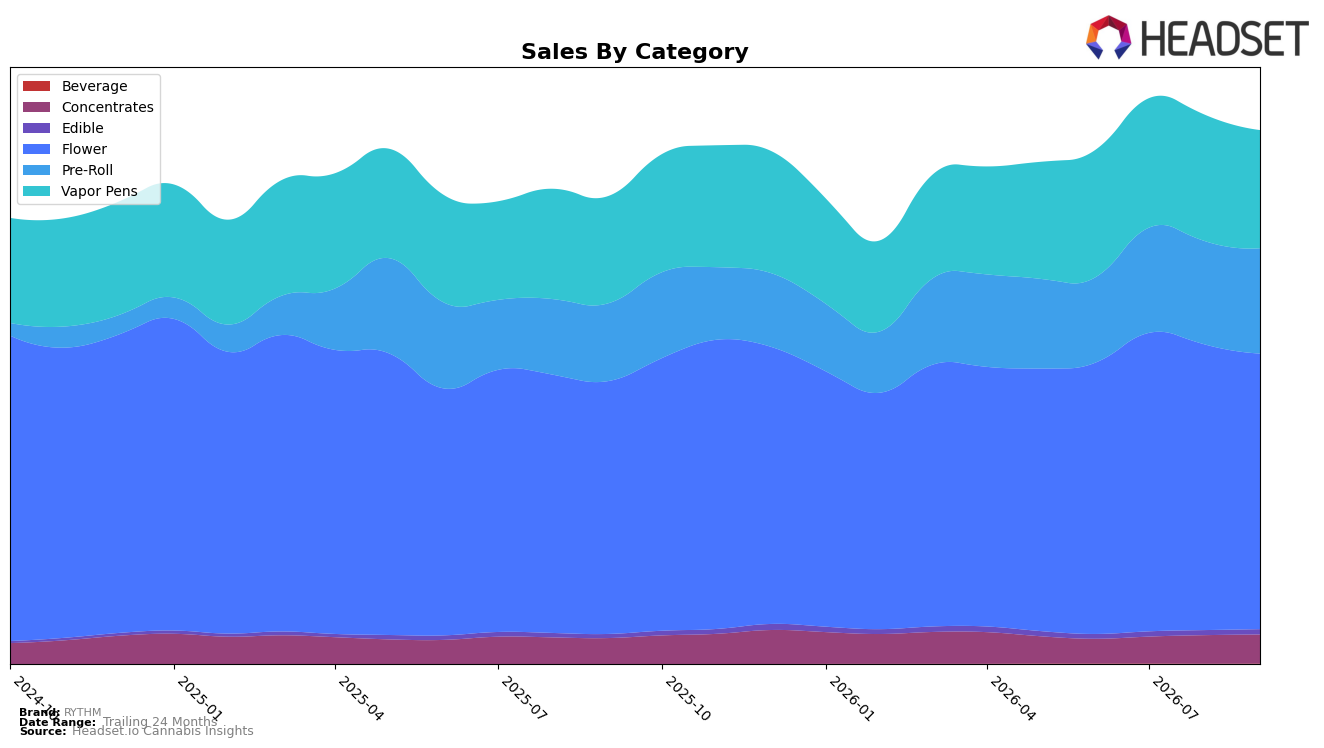
In September 2026, RYTHM’s category mix leaned on Flower at 51.71% share with 9.00% YoY growth but a -3.54% MoM dip, while Vapor Pens held 22.14% share at 10.21% YoY growth yet fell -6.52% MoM; by contrast, Pre-Roll rose to 19.72% share with 35.52% YoY growth and a 1.90% MoM gain. Smaller lines added incremental lift as Concentrates grew 12.49% YoY with a 1.89% MoM uptick at 5.41% share, and Edible advanced 32.45% YoY with a 5.57% MoM rise despite a 0.95% share, while Beverage expanded 50.52% MoM off a 0.07% share with no YoY comp. With average price down 5.22% YoY to $37.06 and total brand sales up 14.14% YoY, the pattern implies volume is shifting toward value-accessible formats and multi-pack Pre-Roll, while core inhalables are experiencing short-term price or velocity pressure.
The simultaneous Pre-Roll share expansion (+19.72% mix) alongside MoM contractions in Flower (-3.54%) and Vapor Pens (-6.52%) implies a pivot toward transaction efficiency and trial-friendly unit economics that can support retail basket capture without relying on premium pricing. Holding a number 1 rank in Flower in Nevada while Flower mix softens month over month suggests RYTHM’s positioning benefits from leadership credentials in key Flower markets even as portfolio balance tilts toward higher-growth Pre-Roll and steady Concentrates (+1.89% MoM), indicating headroom to protect flagship Flower leadership while using Pre-Roll momentum (+35.52% YoY) to backfill near-term volatility in Vapor Pens.
Competitive Landscape
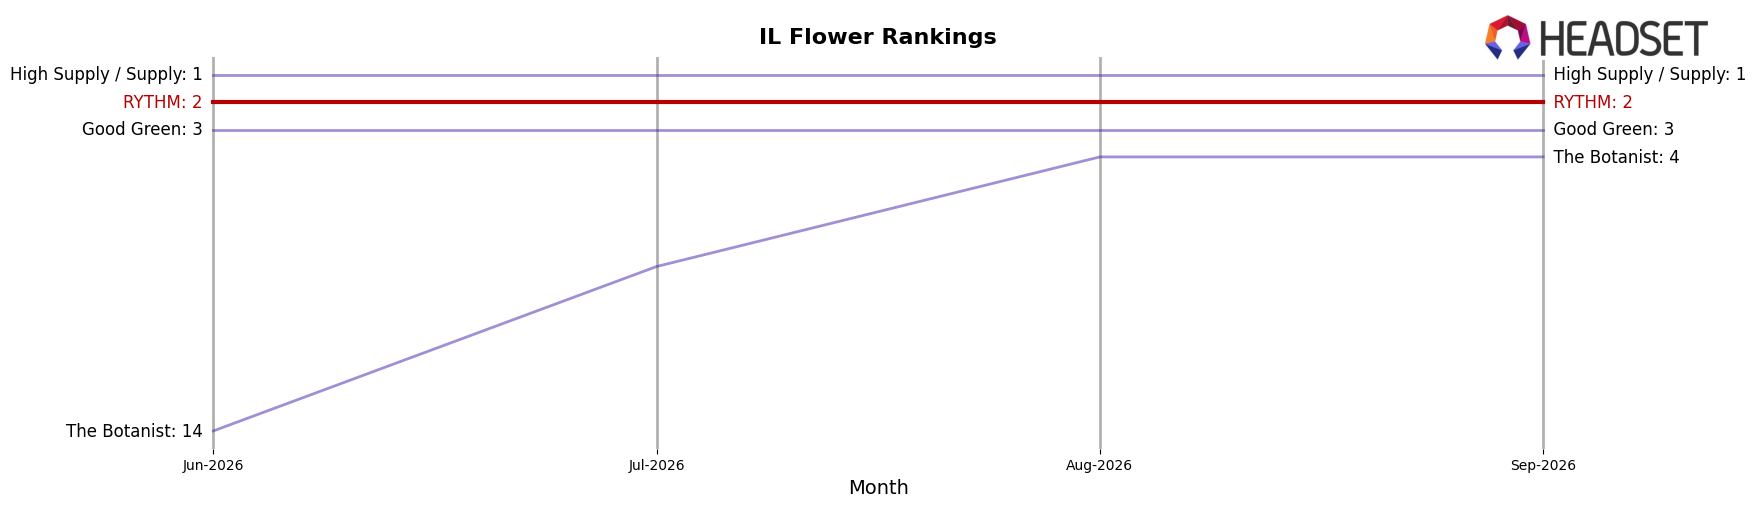
RYTHM sits at rank #2 in Illinois Flower in September 2026, unchanged YoY from rank #2, while category leader High Supply / Supply holds #1 with a -2.5% YoY sales change and Good Green advances from #4 to #3 on +33.8% YoY growth; meanwhile, The Botanist surges from #27 to #4 on +495.0% YoY, outpacing Daze Off, which slid from #3 to #5 with -14.2% YoY. With RYTHM steady at #2 across the last three months and peaking at #2 in September 2026, the pattern implies durable placement but rising pressure from faster-moving challengers that could compress share if momentum persists.
Notable Products
Brownie Scout (3.5g) posted the steepest decline at -11.4% MoM while sliding to rank 2, whereas Animal Face (3.5g) rose 29.7% MoM to hold rank 1. Within Pre-Rolls, Remix - Blue DRM Infused Pre-Roll 5-Pack (2.5g) fell -15.2% MoM at rank 5, while Remix - Pineapple Express Infused Pre-Roll 5-Pack (2.5g) in rank 4 inched up 3.1% MoM, and six of the top ten are Pre-Roll SKUs that cluster around ranks 3–10 with mixed momentum. Together, this split—Flower leadership driven by Animal Face alongside a broad but uneven Pre-Roll bench—implies RYTHM is leaning on a flagship Flower SKU for headline growth while testing depth across Remix formats to stabilize category share.
Top Selling Cannabis Brands






Data for this report comes from real-time sales reporting by participating cannabis retailers via their point-of-sale systems, which are linked up with Headset’s business intelligence software. Headset’s data is very reliable, as it comes digitally direct from our partner retailers. However, the potential does exist for misreporting in the instance of duplicates, incorrectly classified products, inaccurate entry of products into point-of-sale systems, or even simple human error at the point of purchase. Thus, there is a slight margin of error to consider. Brands listed on this page are ranked in the top twenty within the market and product category by total retail sales volume.

