Jun-2026
Sales
Trend
6-Month
Product Count
SKUs
Avg Price
YoY Sales Change
YoY Price Change
Market Insights Snapshot
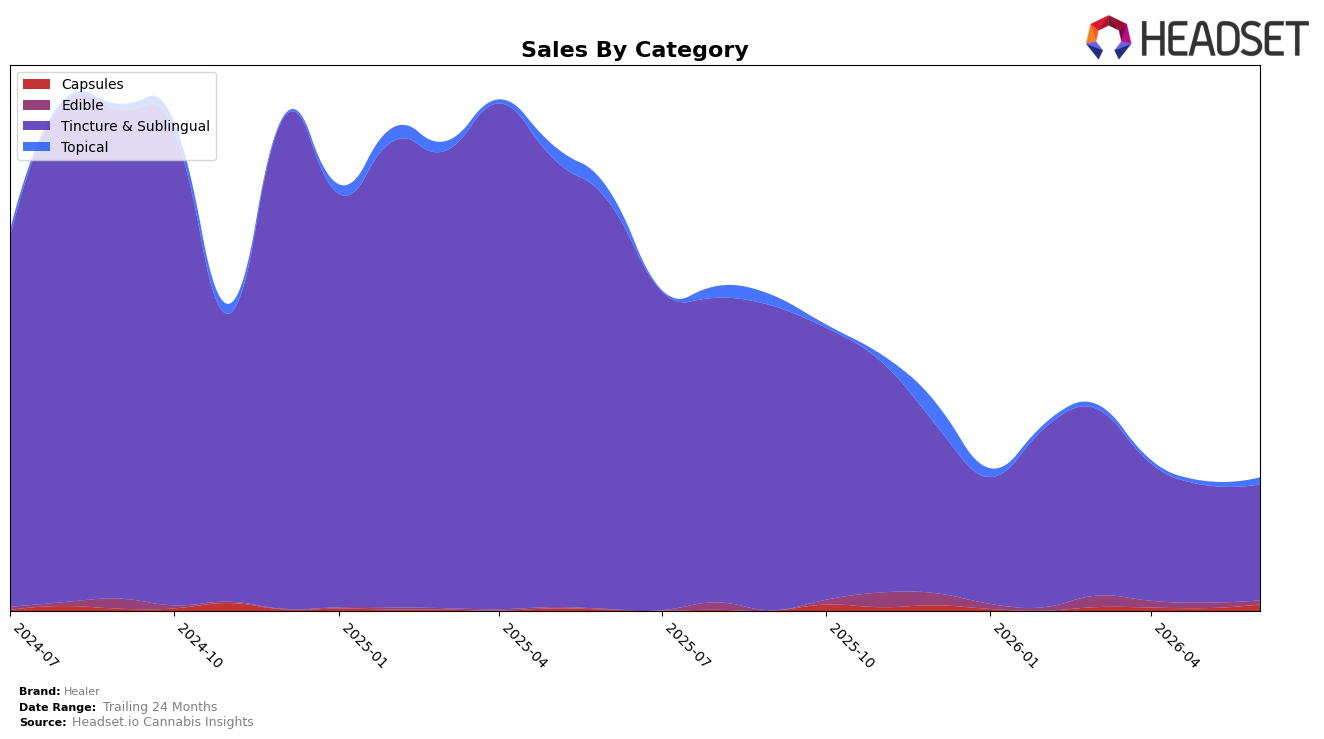
Healer concentrated 87.67% of June 2026 sales in Tincture & Sublingual, where year-over-year sales fell 71.61% and month-over-month dipped 1.33%, while Capsules, at a 4.73% share, expanded 455.88% YoY and 147.01% MoM. Topical held a 4.92% share with a 44.72% YoY decline but a 77.93% MoM jump, and Edible accounted for 2.68% share with a 28.60% MoM decrease and no YoY comp; combined with a 17.83% YoY increase in average price, the mix indicates demand is consolidating in the legacy tincture base even as smaller formats begin to re-activate. The pattern implies a reliance on a shrinking core while fast-growing Capsules and a recovering Topical offer early diversification signals that have not yet offset the broader 68.61% YoY brand sales contraction.
With Tincture & Sublingual still ranking number 2 in Maryland, Healer retains positional relevance in its core even as the category’s 71.61% YoY slide compresses volume, suggesting near-term share defense paired with selective expansion. The 147.01% MoM surge in Capsules alongside a 77.93% MoM gain in Topical, against a simultaneous 1.33% MoM decline in the dominant tincture line and a 28.60% MoM drop in Edible, indicates the most efficient path to stabilize revenue is to tilt assortment and merchandising toward Capsules and Topical while calibrating price architecture (up 17.83% YoY) to protect rank without further dampening conversion.
Competitive Landscape
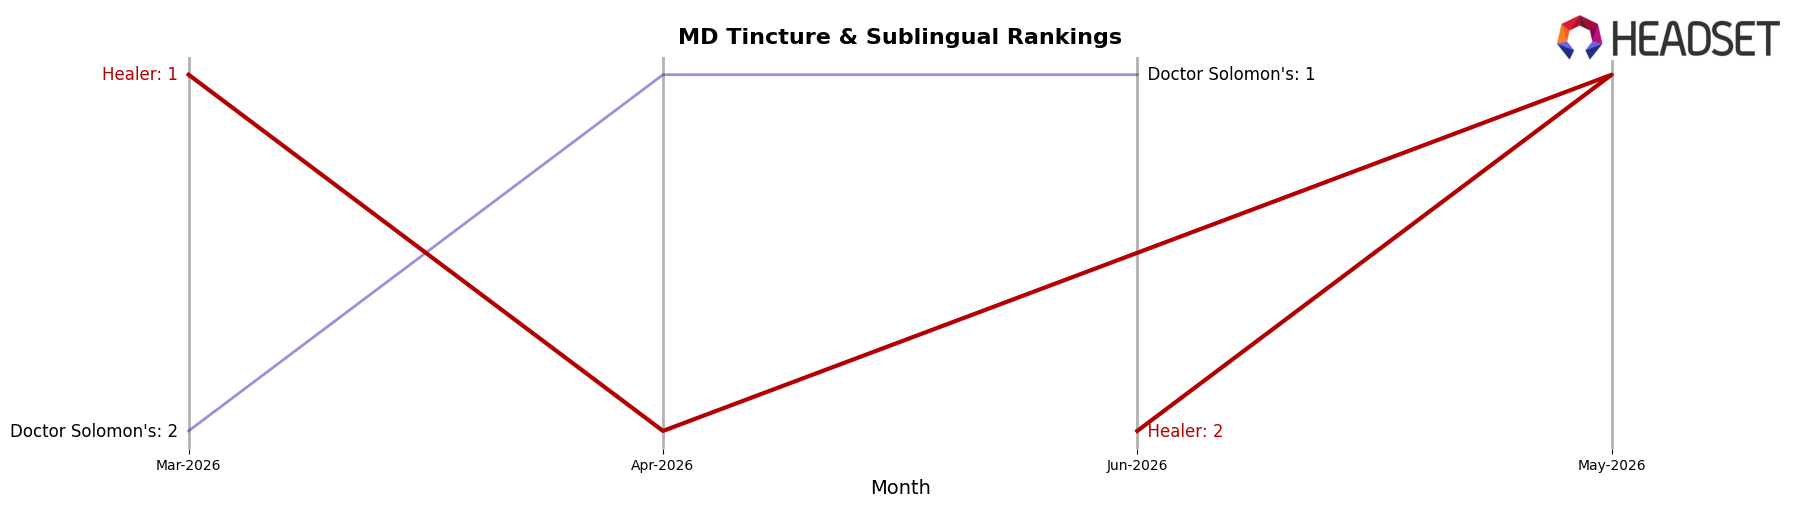
Healer sits at rank #2 in MD Tincture & Sublingual in June 2026, down 1 position year over year from #1, after peaking at #1 in May 2026 and slipping from #1 three months ago to #2 now; meanwhile, Doctor Solomon's holds #1 despite a 45.5% year-over-year sales decline and a fall from #2 to #1 year over year that suggests a weaker hold than its placement implies. Below them, Eastern Shore Extracts climbed from #4 to #3 with 288.1% year-over-year growth, while Cosmec Healing moved from #5 to #4 with 41.1% growth, indicating mid-pack momentum against a top spot under pressure; this rank trajectory implies Healer’s near-term risk is less about defending #2 from declining #1 and more about fending off rapidly advancing #3 and #4 competitors.
Notable Products
THC/THCA 4:1 Uplift Tincture (100mg THC, 25mg THCA) posted the largest month-over-month gain at 80.9% while climbing into a tied rank position at 2, whereas THC/THCa 6:1 Night Tincture (526.44mg THC, 99.96mg THCA) fell 31.6% to rank 3. The top-ranked THC/THCA 1:1 Pain Relief Tincture (315.48mg THC, 327.12mg THCA) slipped 8.3% yet maintained rank 1, and the CBD Topical Hydrogel Cream (850mg CBD) surged 77.8% into rank 7 with $674 in June 2026 sales. With six of the top ten positioned in Tincture & Sublingual, the mix indicates a pivot toward uplifting and functional ratios gaining share at the expense of higher-THC night formulas.
Top Selling Cannabis Brands
Data for this report comes from real-time sales reporting by participating cannabis retailers via their point-of-sale systems, which are linked up with Headset’s business intelligence software. Headset’s data is very reliable, as it comes digitally direct from our partner retailers. However, the potential does exist for misreporting in the instance of duplicates, incorrectly classified products, inaccurate entry of products into point-of-sale systems, or even simple human error at the point of purchase. Thus, there is a slight margin of error to consider. Brands listed on this page are ranked in the top twenty within the market and product category by total retail sales volume.

