Jun-2026
Sales
Trend
6-Month
Product Count
SKUs
Avg Price
YoY Sales Change
YoY Price Change
Market Insights Snapshot
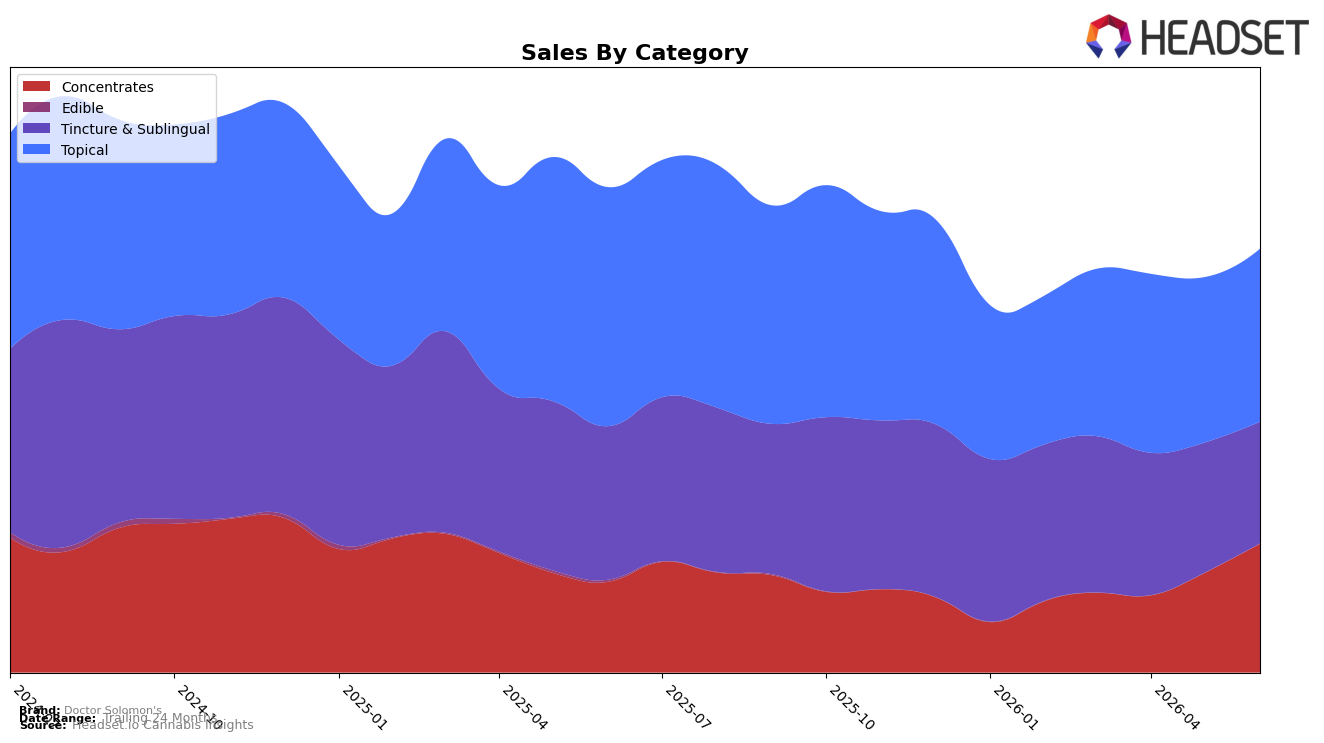
Doctor Solomon's category mix in June 2026 tilted toward Topical at 40.86% share but with a year-over-year decline of 27.63% alongside a month-over-month increase of 4.56%, while Concentrates rose to 30.41% share with a 41.93% YoY increase and a 29.42% MoM jump. Tincture & Sublingual held 28.73% share but fell 20.74% YoY and 6.48% MoM, and the brand’s overall sales declined 12.71% YoY as average price decreased 5.04%, implying volume gains offset by price pressure. The concentration of growth in Concentrates despite Topical’s higher share suggests the mix is pivoting toward higher-velocity formats, and with a category rank of 10 in Concentrates in Maryland, the data imply a shift where maintaining momentum requires reallocating emphasis toward the expanding segment.
The divergence—Topical shrinking 27.63% YoY while Concentrates expanded 41.93% YoY—indicates Doctor Solomon's positioning is migrating from legacy wellness formats toward inhalable use-cases where the brand holds rank 10 in Concentrates in Maryland. The 29.42% MoM surge in Concentrates paired with a 6.48% MoM contraction in Tincture & Sublingual suggests near-term trial and repeat are coalescing in potency-forward formats, and the 5.04% average price decrease alongside a 4.56% MoM lift in Topical implies price-led stabilization rather than category expansion. Taken together, the numbers point to a positioning opportunity: protect Topical share while leaning into Concentrates where velocity is accelerating and June 2026 mix shifts can compound rank gains.
Competitive Landscape
Doctor Solomon's sits at rank #10 in MD Concentrates in June 2026, improving 5 positions from #15 year over year and climbing 7 spots from #17 three months prior, while still trailing its peak at #9 from October 2024; in contrast, District Cannabis held #1 with a 35.7% YoY sales increase and Evermore Cannabis Company moved from #4 to #3 alongside a 23.2% YoY lift, whereas Nature's Heritage slipped from #3 to #5 despite a 17.2% YoY gain; the pattern implies Doctor Solomon's is narrowing the gap through rank momentum rather than outsized category share, and sustaining movement beyond #9 will require converting recent rank gains into durable mid‑tier presence.

Notable Products
The steepest movement in June 2026 was the decline for Doctor Solomon's Indica THC Rich RSO Syringe (1g), which fell 15.9% month over month and sat at rank 10, while CBD/THC 3:1 Unwind Transdermal Balm (135mg CBD, 45mg THC) slipped 11.0% at rank 4. In contrast, CBD/THC 1:3 Rescue Transdermal Balm (30mg CBD, 90mg THC) climbed 32.2% to rank 2, and CBD/THC 1:1 Restore Transdermal Lotion (200mg CBD, 200mg THC, 1.8oz) inched up 6.3% to hold rank 1 with $59,649. Four of the top ten are Topical SKUs clustered in ranks 1–4 and 9, pointing to a portfolio where topical loyalty offsets volatility in RSO concentrates and suggests near-term emphasis on transdermal formats over ingestible or concentrate expansion.
Top Selling Cannabis Brands
Data for this report comes from real-time sales reporting by participating cannabis retailers via their point-of-sale systems, which are linked up with Headset’s business intelligence software. Headset’s data is very reliable, as it comes digitally direct from our partner retailers. However, the potential does exist for misreporting in the instance of duplicates, incorrectly classified products, inaccurate entry of products into point-of-sale systems, or even simple human error at the point of purchase. Thus, there is a slight margin of error to consider. Brands listed on this page are ranked in the top twenty within the market and product category by total retail sales volume.

