.svg)


Market Insights Snapshot
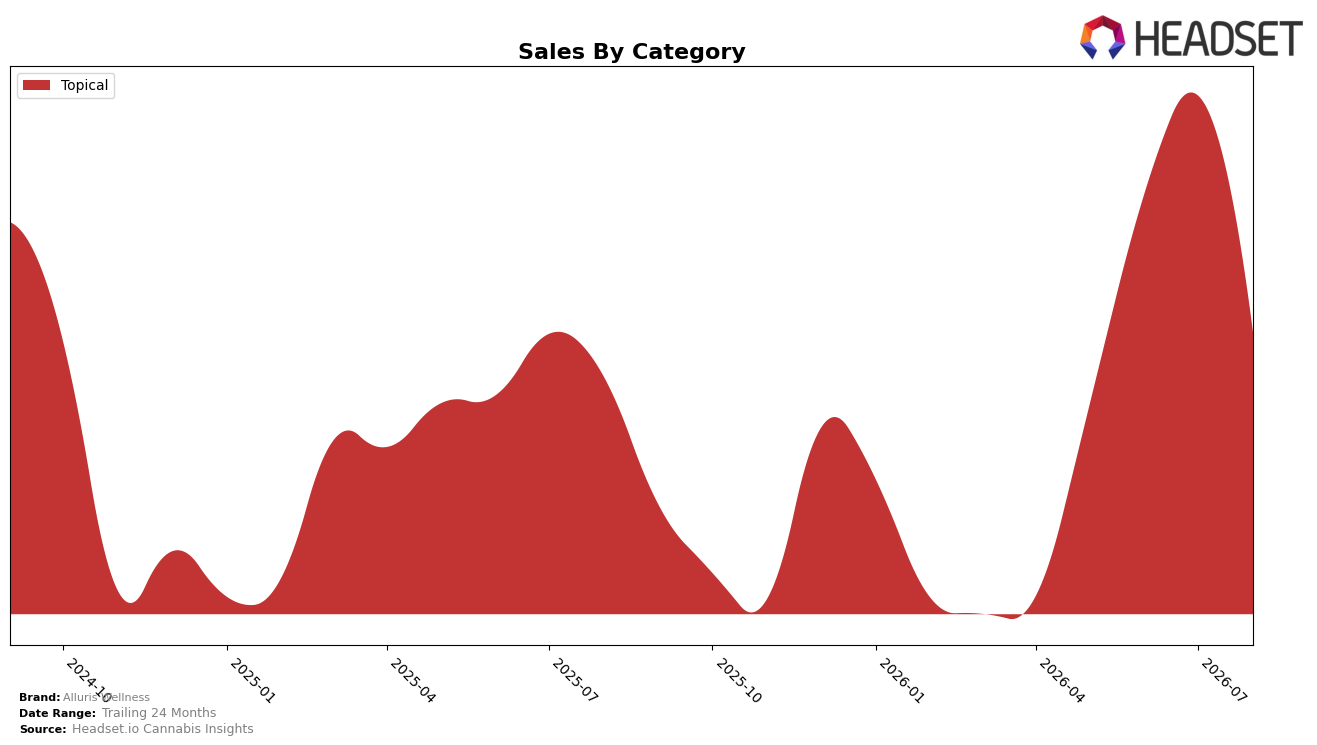
In August 2026, Alluris Wellness concentrated entirely in Topical, with category share at 100.0% and rank position 5 in Topical within Illinois. Year over year, Topical sales rose 15.33%, while month over month they fell 41.65%, and average price declined 7.34% YoY alongside a category-level mix that left no secondary categories to buffer the MoM downswing. The pattern implies the brand is overexposed to a single-category swing: the August 2026 MoM contraction suggests volume volatility outpacing the 15.33% YoY gain at a time when price is moving down, concentrating risk in one lane despite holding rank 5.
The mix shift toward a 100.0% Topical footprint means positioning hinges on defending rank 5 while managing a 41.65% MoM pullback and a 7.34% YoY price decrease. With 24‑month sales down 41.59% versus a current 15.33% YoY rise, the brand is clawing back within Topical rather than broadening, implying a strategy geared to price-accessible Topical velocity rather than multi-category diversification; the key is converting the YoY momentum into sustained rank stability without relying on discounting-driven gains.
Competitive Landscape
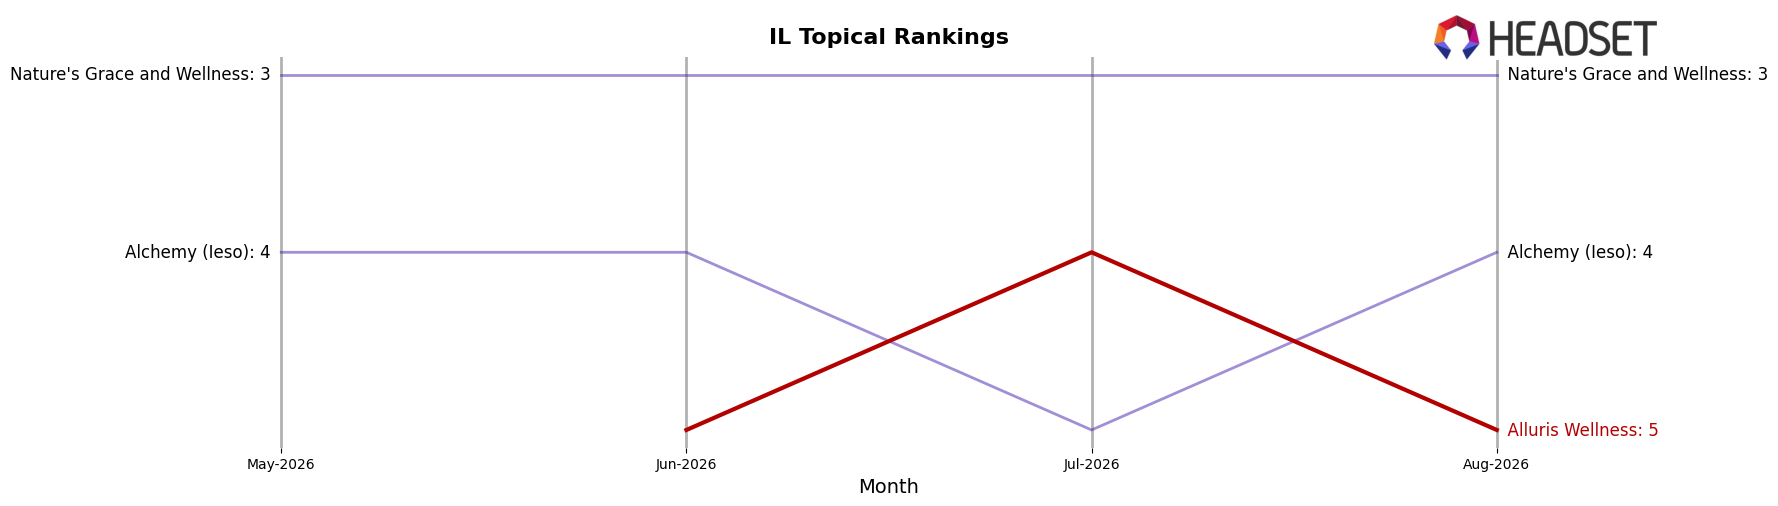
Alluris Wellness sits at #5 in IL Topical in August 2026, unchanged YoY from #5, with a near-term climb from #6 three months ago and a peak at #4 in July 2026; meanwhile, Avexia held #1 both YoY and currently despite a -1.4% sales decline, and Doctor Solomon's stayed at #2 while facing a -32.8% sales drop. In contrast, Nature's Grace and Wellness maintained #3 alongside a +10.0% YoY sales gain, and Alchemy (Ieso) held #4 with a -12.8% YoY contraction; this mix of stability at the top with divergent sales trends suggests Alluris Wellness’s flat YoY rank masks a tightening gap above and a vulnerability to upward pressure from brands with positive momentum.
Notable Products
CBD/THC/CBG 1:1:1 Soothe Lotion (100mg CBD, 100mg THC, 100mg CBG, 3oz, 15ml) led August 2026 by rank 1 despite a -41.7% month-over-month decline, indicating a sharp pullback at the very top of the Topical lineup. Holding the number 1 position while dropping over forty percent suggests demand is concentrated but volatile, and the category may be over-reliant on a single flagship SKU. The combination of a rank 1 finish with a -41.7% contraction and a single-month revenue of $10,282 implies the brand’s assortment priority skews toward a hero product that now needs diversification to stabilize monthly variability.
Top Selling Cannabis Brands






Data for this report comes from real-time sales reporting by participating cannabis retailers via their point-of-sale systems, which are linked up with Headset’s business intelligence software. Headset’s data is very reliable, as it comes digitally direct from our partner retailers. However, the potential does exist for misreporting in the instance of duplicates, incorrectly classified products, inaccurate entry of products into point-of-sale systems, or even simple human error at the point of purchase. Thus, there is a slight margin of error to consider. Brands listed on this page are ranked in the top twenty within the market and product category by total retail sales volume.

