Jun-2026
Sales
Trend
6-Month
Product Count
SKUs
Avg Price
YoY Sales Change
YoY Price Change
Market Insights Snapshot
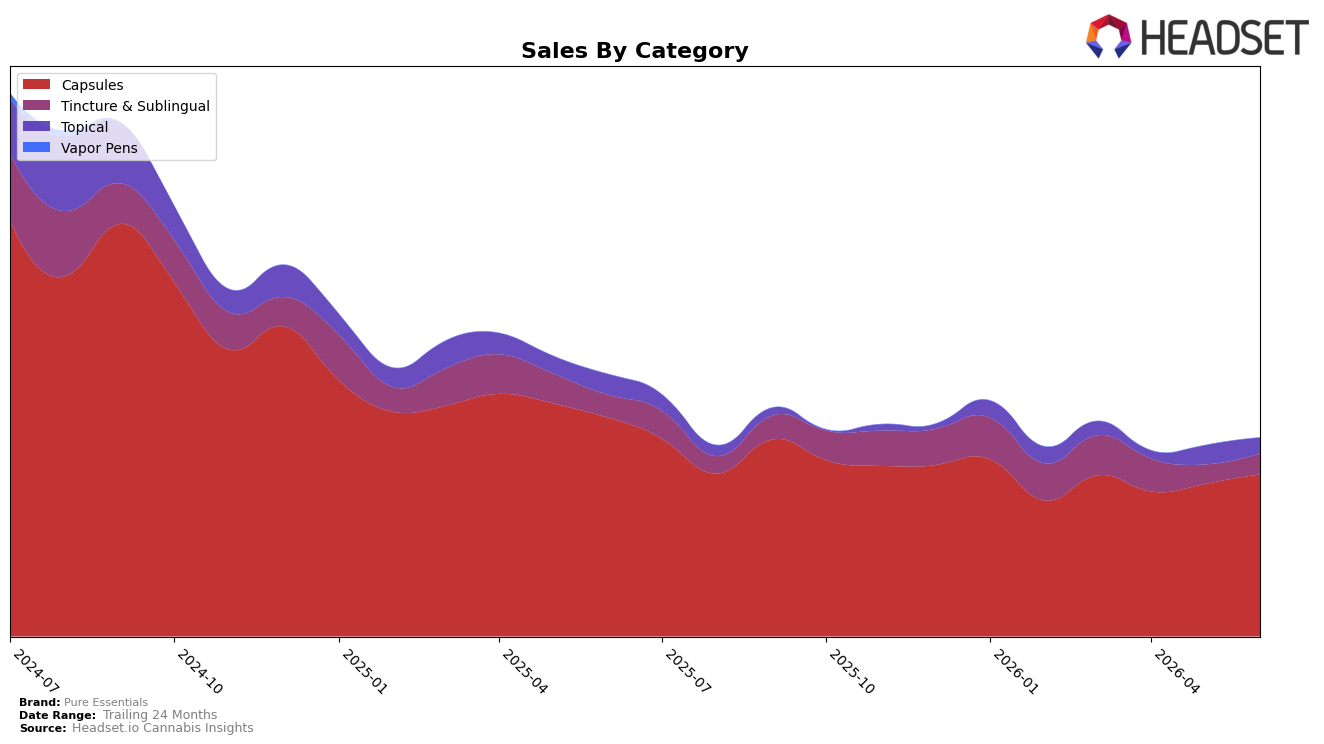
In June 2026, Pure Essentials concentrated 81.78% of sales in Capsules with a month-over-month increase of 6.37% but a year-over-year decline of 25.98%, while Tincture & Sublingual held 10.48% share with 7.67% MoM growth and an 8.33% YoY decline; Topical accounted for 7.74% share with an 18.49% MoM drop and a 24.28% YoY decline. The overall brand registered a 24.32% YoY sales contraction alongside an 11.46% YoY average price decrease to $16.96, and within Illinois Capsules the brand sat at rank 3. The pattern implies a reliance on Capsules to offset broader contraction through modest MoM volume gains, while price compression and Topical retrenchment constrain recovery, concentrating competitive footing at a high rank but in a narrowing mix.
The mix shift—Capsules stabilizing near 82% share with 6.37% MoM growth as Topical falls 18.49% MoM—suggests the brand is consolidating around a single purchase mission where price elasticity aided unit movement after an 11.46% YoY price cut, yet diversification is weakening as two of three categories post double-digit YoY declines. Holding rank 3 in Illinois Capsules despite a 25.98% YoY drop indicates defensible placement within that format, but the 66.92% sales erosion over 24 months and a shrinking Topical contribution point to positioning that increasingly depends on Capsule SKU depth and execution rather than a balanced portfolio, implying exposure if category growth rotates away from Capsules.
Competitive Landscape
Pure Essentials sits at rank #3 in IL Capsules in June 2026, unchanged from #3 year over year, with a flat trajectory also holding at #3 over the past three months; in contrast, 1906 remains #1 despite a -53.2% YoY sales change, while Avexia holds #2 with a -36.0% YoY sales change, and Breez slipped from #4 to #5 alongside a -71.1% YoY sales change. With peers at the top experiencing double-digit YoY declines and rank stability at #3 since June 2026 peak rank, the pattern implies Pure Essentials’ rank is insulated by competitor contraction but capped by limited upward displacement unless #1 or #2 weakens further or Pure Essentials accelerates share capture.

Notable Products
Relax Hybrid Chill Pill Capsule 10-Pack (100mg) posted the largest movement in June 2026 with a 93.6% MoM surge to $10,246 and rose to rank 1, while Indica Night Capsules 10-Pack (100mg) fell 20.5% MoM to rank 4. Sativa Momentum Capsules 10-Pack (100mg) slipped 6.8% MoM at rank 2 as CBD/THC 2:1 CBD Capsules 10-Pack (200mg CBD, 100mg THC) dropped 23.8% MoM to rank 7, and the category mix concentrated further with eight of the top ten being Capsules. The combined pattern of a near‑doubling leader and double‑digit declines in adjacent Capsules implies a pivot toward a single hero SKU strategy that risks over-reliance on one format unless diversification recovers.
Top Selling Cannabis Brands
Data for this report comes from real-time sales reporting by participating cannabis retailers via their point-of-sale systems, which are linked up with Headset’s business intelligence software. Headset’s data is very reliable, as it comes digitally direct from our partner retailers. However, the potential does exist for misreporting in the instance of duplicates, incorrectly classified products, inaccurate entry of products into point-of-sale systems, or even simple human error at the point of purchase. Thus, there is a slight margin of error to consider. Brands listed on this page are ranked in the top twenty within the market and product category by total retail sales volume.

