.svg)

Sep-2026
Sales
Trend
6-Month
Product Count
SKUs
Avg Price
YoY Sales Change
YoY Price Change


Where to Buy
Angel (OR) is stocked at 113 licensed dispensaries across Oregon, with the deepest coverage in Portland, Eugene, Medford, Bend, and Astoria. Search by ZIP code or city below to find the closest one, or filter by product type if you are after a specific format.
Market Insights Snapshot
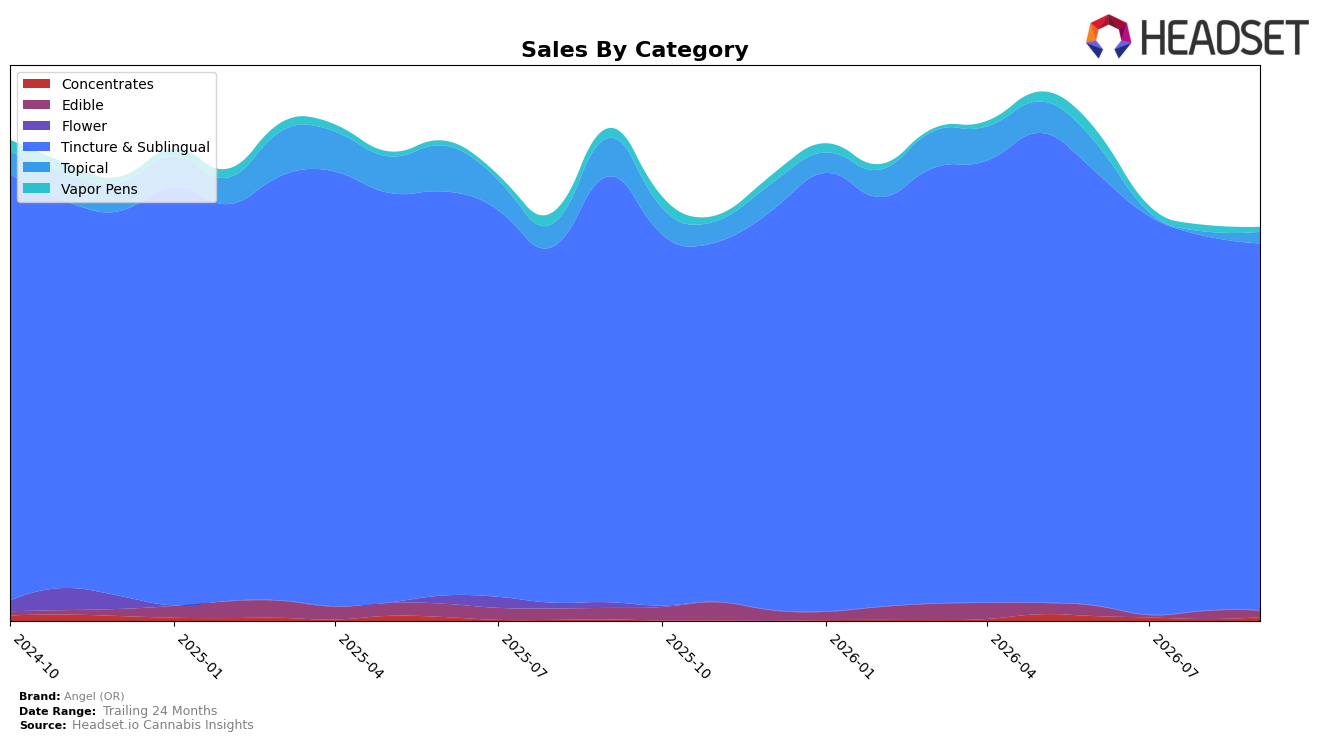
Angel (OR) concentrated 93.49% of September 2026 sales in Tincture & Sublingual, where year-over-year declined 13.86% and month-over-month slipped 2.10%, while Topical, at 2.82% share, fell 70.99% YoY but surged 172.82% MoM. Smaller lines were mixed: Edible held 1.55% share with a 45.14% YoY drop and an 18.99% MoM decline, Vapor Pens at 1.17% share decreased 50.82% YoY and 25.61% MoM, and Concentrates at 0.97% share jumped 152.82% YoY and 96.77% MoM. With average price up 3.85% YoY to $30.90 and overall brand sales down 20.12% YoY, the pattern suggests a highly concentrated portfolio in Oregon that is stabilizing via price while secondary categories deliver volatility rather than material share gains.
The category mix implies defensible positioning anchored in a rank of 1 within Tincture & Sublingual in Oregon, but the 93.49% reliance amplifies exposure to that segment’s 13.86% YoY and 2.10% MoM contractions, limiting offset from the 152.82% YoY and 96.77% MoM spike in Concentrates due to its 0.97% share. The 172.82% MoM rebound in Topical alongside a 70.99% YoY decline indicates reactivation rather than sustained scale, and the concurrent 50.82% YoY and 25.61% MoM declines in Vapor Pens and the 45.14% YoY, 18.99% MoM declines in Edible point to limited adjacency pull; together, these shifts imply the brand’s differentiation remains concentrated in tinctures, so risk mitigation would come from methodical share build in 1–3% share categories rather than continued price dependence.
Competitive Landscape
Angel (OR) holds rank #1 in Oregon Tincture & Sublingual for September 2026 with a year-over-year rank change of 0 (steady at #1), while its 3-month position also stayed at #1, implying sustained category leadership; meanwhile, Hapy Kitchen sits at #2 after improving from #3 year over year as its sales rose 68.6%, and Mule Extracts climbed to #5 from #11 with 347.8% sales growth, suggesting upward pressure from fast movers as Angel (OR) maintains its peak rank of #1 in September 2026. The directional shifts show High Desert Pure advancing to #3 from #4 on 58.0% sales growth while Farmer's Friend Extracts declined to #4 from #2 despite a 10.4% increase, indicating that Angel (OR)’s unchanged #1 across both year-over-year and recent quarters sits atop accelerating competitors, implying the brand must defend share against rising #2–#5 contenders despite its stable rank trajectory.

Notable Products
The steepest movement in September 2026 was THC Unflavored Tincture (1000mg), which fell -49.8% while holding rank 1, and Indica Tincture (1000mg) declined -35.6% at rank 4, indicating top-tier volume concentrated in products with double‑digit contraction. CBD Flavorless Hemp Tincture (3000mg CBD, 30ml) also slid -15.8% at rank 6, whereas Sativa Tincture (1000mg) inched up 12.0% at rank 3, and four of the top ten are Tincture & Sublingual SKUs that collectively define the leaderboard. CBD Flavorless Hemp Tincture (1500mg CBD, 30ml) was nearly flat at +1.7% at rank 3, and the only non-tincture in the top five, Blueberry Lemonade Blossom Gummy (100mg), climbed 39.8% at rank 5 with $1,338 in sales. The pattern implies reliance on a tincture-heavy mix where leaders are softening, pushing Angel (OR) toward either premium reformulation or diversification beyond tinctures to stabilize rank and month-to-month momentum.
Top Selling Cannabis Brands






Data for this report comes from real-time sales reporting by participating cannabis retailers via their point-of-sale systems, which are linked up with Headset’s business intelligence software. Headset’s data is very reliable, as it comes digitally direct from our partner retailers. However, the potential does exist for misreporting in the instance of duplicates, incorrectly classified products, inaccurate entry of products into point-of-sale systems, or even simple human error at the point of purchase. Thus, there is a slight margin of error to consider. Brands listed on this page are ranked in the top twenty within the market and product category by total retail sales volume.

