Jun-2026
Sales
Trend
6-Month
Product Count
SKUs
Avg Price
YoY Sales Change
YoY Price Change
Market Insights Snapshot
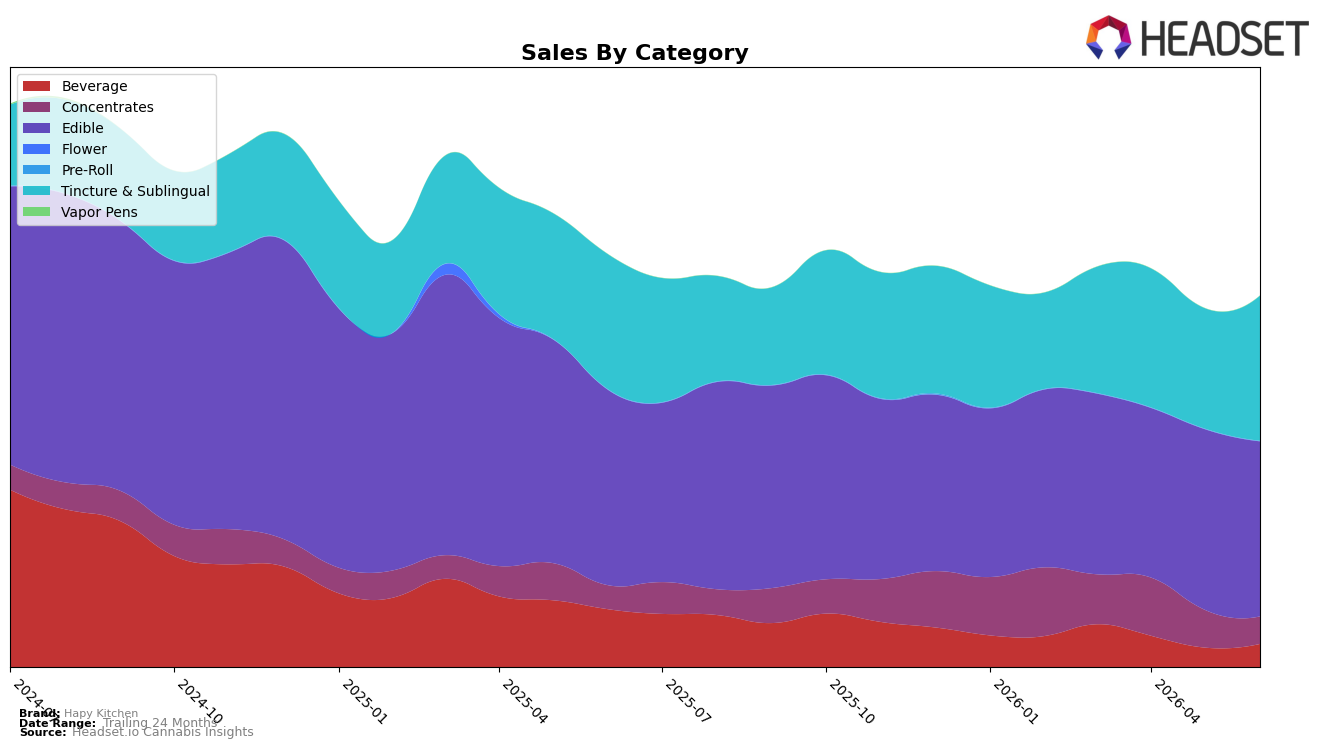
In June 2026, Hapy Kitchen’s mix tilted toward Edible at 47.27% share and rank 14 in Edible within Oregon, even as Edible declined 10.35% year over year and 3.08% month over month. Offsetting that drag, Tincture & Sublingual reached 39.17% share with 7.45% YoY growth and a 20.52% MoM surge, while Concentrates held 7.37% share with 14.97% YoY growth but dropped 27.42% MoM, and Beverage at 6.19% share fell 60.26% YoY yet rose 18.98% MoM. With total brand sales down 10.04% YoY and average price up 3.41%, the pattern implies mix pressure from a contracting Edible core, partially cushioned by faster-growing Tincture & Sublingual and a volatile Concentrates line.
The June 2026 shifts imply a deliberate pivot toward higher-price and growth pockets to stabilize revenue: Tincture & Sublingual’s 20.52% MoM gain at a $17.78 average price contrasts with Edible’s 3.08% MoM decline at $6.81, signaling a margin-focused reweighting even as the portfolio still leans 47.27% toward Edible. The 27.42% MoM drop in Concentrates alongside a 14.97% YoY lift suggests promotional or distribution variability rather than sustained traction, while Beverage’s 18.98% MoM uptick amid a 60.26% YoY fall points to tactical recovery, not a foundation category. The thesis is that maintaining rank 14 in Edible in Oregon while growing Tincture & Sublingual share is the quickest route to arrest the 10.04% YoY brand decline, with execution risk concentrated in categories showing high month-to-month volatility.
Competitive Landscape
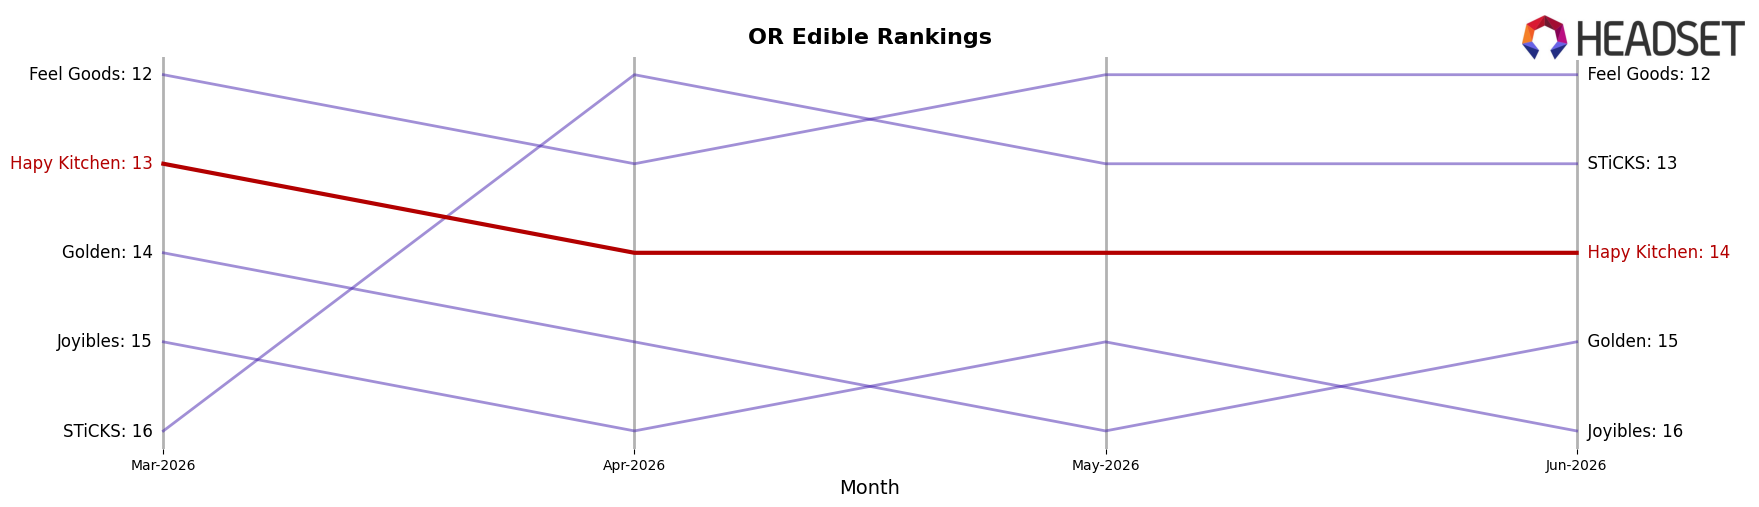
Hapy Kitchen sits at #14 in OR Edible for June 2026, slipping 1 rank position year over year from #13 while holding flat versus three months ago at #13 to #14, and this contrasts with Wyld holding #1 year over year at #1 to #1 alongside a 45.3% sales increase and Gron / Grön remaining at #2 with a 104.6% sales decline; despite Hapy Kitchen’s historical peak at #8 in October 2024 and competitors like Good Tide rising to #4 with an 88.9% YoY sales gain, the brand’s -1 rank shift and lack of quarter-on-quarter momentum imply it is ceding relative position to faster-accelerating leaders and needs mix or promotional change to reenter the top 10.
Notable Products
The steepest decline came from THC/CBN 1:1 Brown Butter Bliss Sugar Magnolia Hash Rosin Infused Cookie (100mg CBN, 100mg THC), down 17.0% month over month and sitting at rank 6, while the CBG/THC 2:1 Hapy Birthday Brownie With White Chocolate (50mg CBG, 100mg THC) fell 26.6% and also held rank 6 due to a category tie. In contrast, Relax Indica Chai Spice Tincture (1000mg THC, 1oz) rose 30.8% to rank 9, and Chocolate Brownie (100mg) in rank 1 inched up 2.2% with $19,940 in June 2026 sales. Four of the top ten are Cookie SKUs, and three Brownie variants occupy ranks 1-3 with MoM gains of 2.2%, 21.4%, and 26.1%, indicating a tilt toward classic brownie formats even as functional Cookie formulas retrench. The pattern implies Hapy Kitchen’s June 2026 mix is consolidating around core brownie-led Edibles while selective Tincture growth offsets weakness in CBN/CBG Cookie experiments.
Top Selling Cannabis Brands
Data for this report comes from real-time sales reporting by participating cannabis retailers via their point-of-sale systems, which are linked up with Headset’s business intelligence software. Headset’s data is very reliable, as it comes digitally direct from our partner retailers. However, the potential does exist for misreporting in the instance of duplicates, incorrectly classified products, inaccurate entry of products into point-of-sale systems, or even simple human error at the point of purchase. Thus, there is a slight margin of error to consider. Brands listed on this page are ranked in the top twenty within the market and product category by total retail sales volume.

