May-2026
Sales
Trend
6-Month
Product Count
SKUs
Avg Price
YoY Sales Change
YoY Price Change
Market Insights Snapshot
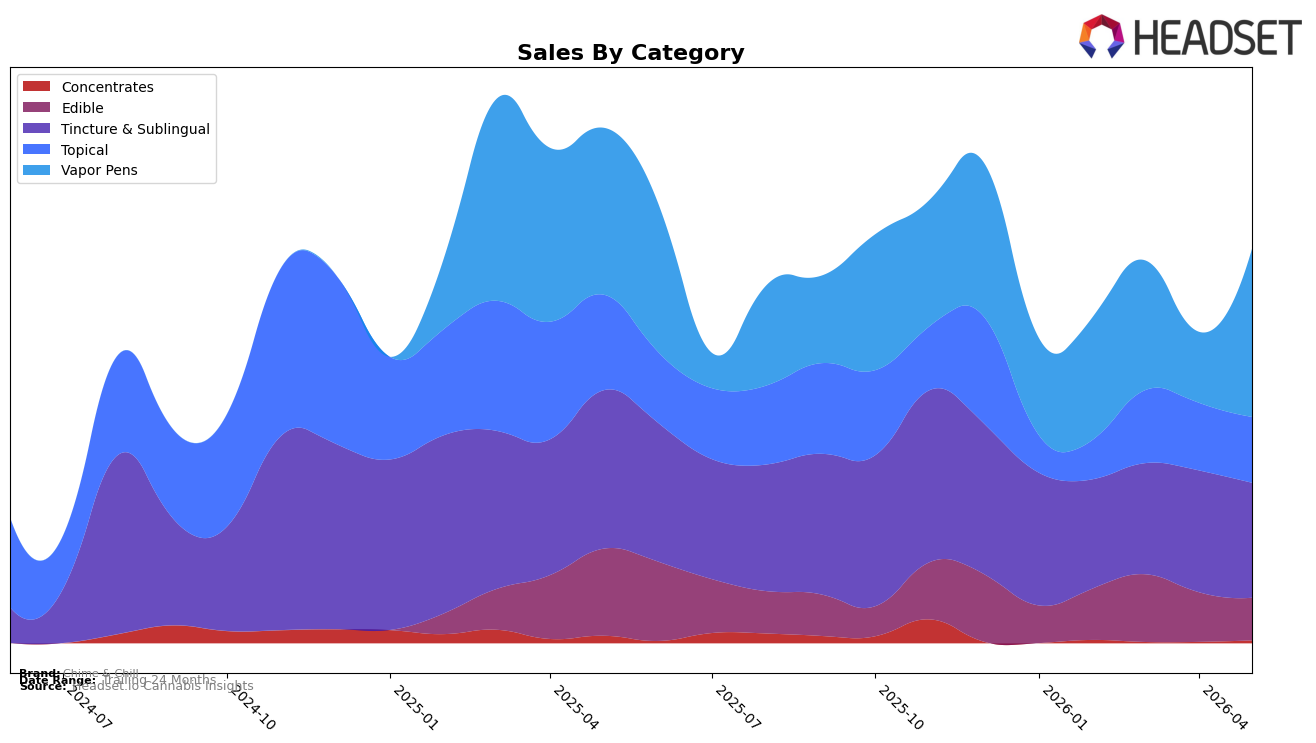
In May 2026, Chime & Chill’s mix pivoted toward Vapor Pens at 42.66% share with 137.21% month-over-month growth and 0.70% year-over-year lift, while legacy pillar Tincture & Sublingual fell to 29.15% share with -5.63% MoM and -27.46% YoY. Topical contracted to 16.69% share with -2.62% MoM and -31.15% YoY, and Edible slid to 10.79% share with -14.24% MoM and -51.10% YoY, even as Concentrates remained a niche at 0.70% share but jumped 113.77% MoM against a -62.71% YoY base. With overall brand sales down 23.52% YoY but up 255.17% over 24 months and average price up 3.65% YoY to $37.91, the pattern implies short-term contraction within traditional wellness formats while near-term momentum concentrates in inhalables, re-weighting revenue toward quicker-turn categories.
The shift toward Vapor Pens alongside price inflation of 3.65% YoY suggests the brand is trading into higher-velocity, higher-ticket SKUs while ceding ground in format-driven wellness segments where Tincture & Sublingual posted -27.46% YoY and Topical posted -31.15% YoY. Given that Tincture & Sublingual remains the top category by historical positioning in New York but carries a -5.63% MoM decline versus a 137.21% MoM surge in Vapor Pens, the mix shift implies a repositioning from dosage control narratives toward immediacy and convenience, with the risk of weakening differentiation in wellness-led baskets as Edible also fell -14.24% MoM. The combined pattern of MoM gains concentrated in Vapor Pens and Concentrates (113.77% MoM) implies near-term share capture through inhalable-first assortments, but sustaining growth will require stabilizing Tincture & Sublingual’s -27.46% YoY erosion to maintain relevance with routine-use customers.
Competitive Landscape
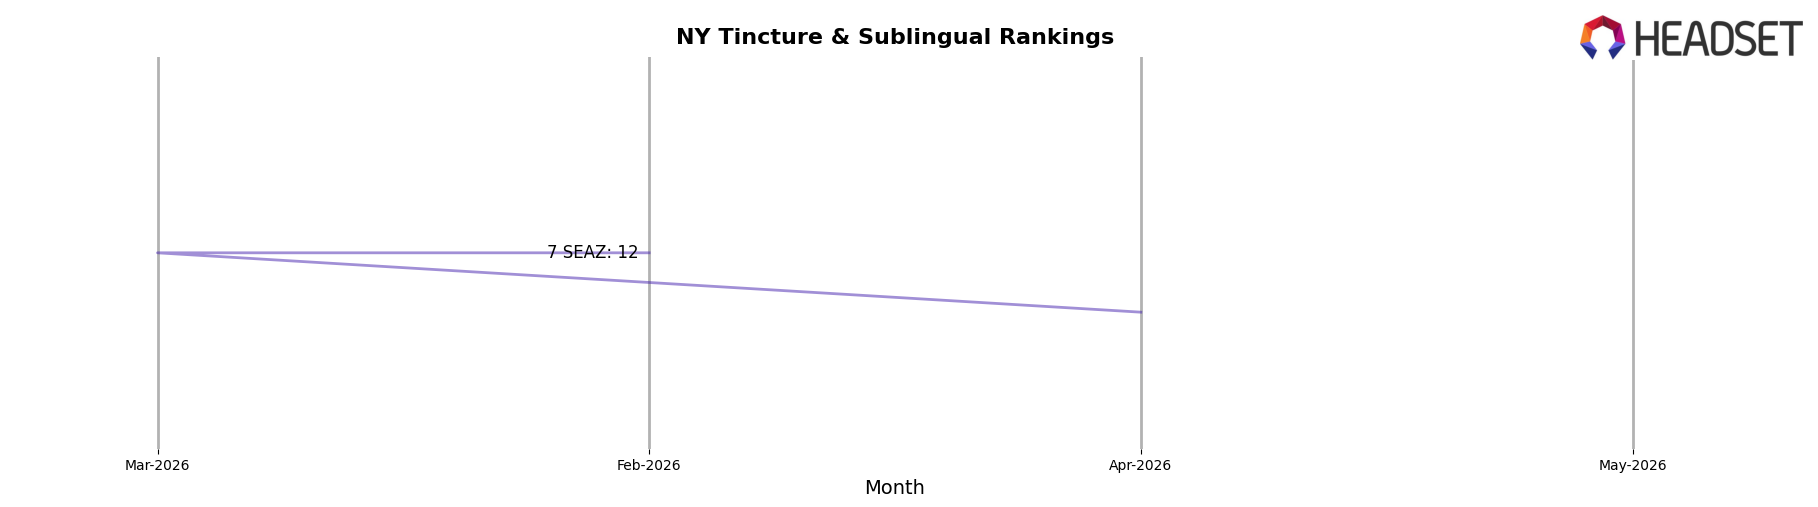
Chime & Chill ranks #14 in NY Tincture & Sublingual in May 2026, down 4 positions year over year from #10, with rank flat versus February 2026 at #14 but off its peak of #8 reached in November 2024; meanwhile, Ayrloom sits at #1 with a 0-place YoY change and a 22.5% YoY sales increase, and Mfny (Marijuana Farms New York) slid from #3 to #4 alongside a 34.6% YoY sales decline, indicating that Chime & Chill’s four-rank YoY drop positions it behind leaders consolidating share and signals that without a reversal, the brand is trending toward the lower mid-tier rather than recovering toward its prior #8 peak.
Notable Products
K.O- CBD The Money Melon Distillate Disposable (1g) delivered the standout movement in May 2026 with a +223.3% month-over-month surge that vaulted it to rank 2, while the K.O- CBD It's Mint Distillate Disposable (1g) also jumped +114.9% to rank 5. In contrast, the K.O. - CBD Double Dose Tincture (4500mg CBD, 30ml) fell -10.8% yet held rank 1, indicating share stability at the top despite a pullback. With three Vapor Pens in the top five and another pen posting +85.5% at rank 3, the concentration in inhalable formats signals a pivot toward faster-acting SKUs and away from slower-moving topicals and confections, even as a legacy tincture still anchors the leaderboard.
Top Selling Cannabis Brands
Data for this report comes from real-time sales reporting by participating cannabis retailers via their point-of-sale systems, which are linked up with Headset’s business intelligence software. Headset’s data is very reliable, as it comes digitally direct from our partner retailers. However, the potential does exist for misreporting in the instance of duplicates, incorrectly classified products, inaccurate entry of products into point-of-sale systems, or even simple human error at the point of purchase. Thus, there is a slight margin of error to consider. Brands listed on this page are ranked in the top twenty within the market and product category by total retail sales volume.

