Jun-2026
Sales
Trend
6-Month
Product Count
SKUs
Avg Price
YoY Sales Change
YoY Price Change
Market Insights Snapshot
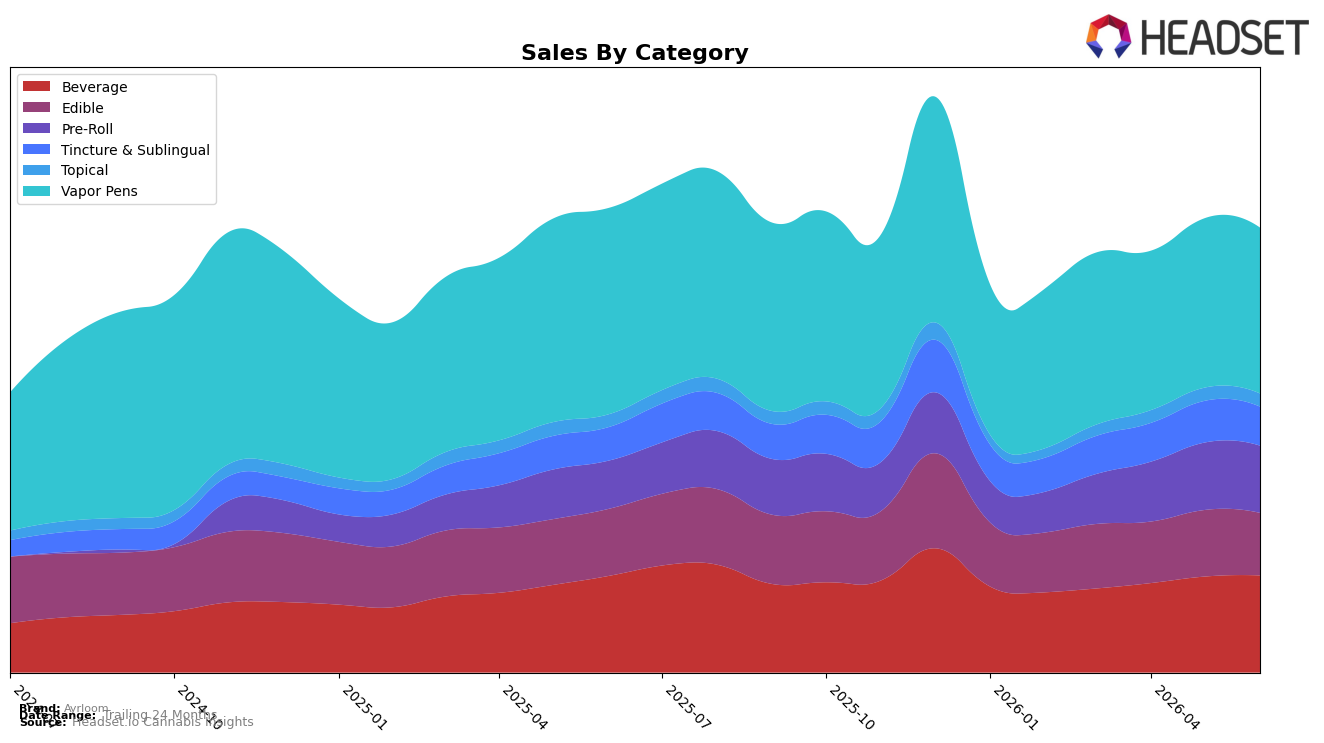
In June 2026, Ayrloom’s mix concentrated 37.34% in Vapor Pens (ranked 3 in New York) with category sales down 19.64% year over year and 2.10% month over month, while Beverage held 21.85% share with sales up 0.60% YoY and 1.19% MoM. Pre-Roll expanded to 15.10% share with a 39.55% YoY lift despite a 0.26% MoM dip, as Edible at 14.05% share fell 6.71% YoY and 6.08% MoM. Tincture & Sublingual contributed 8.74% share with 16.53% YoY growth but a 6.49% MoM decline, and Topical at 2.92% share rose 2.85% YoY with a 0.30% MoM slip. With total brand sales down 4.22% YoY and average price down 14.67% YoY to $15.04, the pattern implies reliance on a contracting Vapor Pens anchor while growth pockets in Pre-Roll and Tincture & Sublingual offset but do not fully counterbalance category headwinds.
The shifting mix suggests Ayrloom’s positioning is tilting from a single-category engine toward a barbell of inhalables and function-forward formats: gains of 39.55% YoY in Pre-Roll and 16.53% YoY in Tincture & Sublingual contrast with a 19.64% YoY decline in Vapor Pens and a 6.71% YoY drop in Edible. Month over month, incremental Beverage growth of 1.19% alongside MoM declines of 6.08% in Edible and 6.49% in Tincture & Sublingual indicates near-term promotional or pricing dependency, consistent with a 14.67% YoY average price reduction. The implication is a pivot opportunity: lean into Pre-Roll and Tincture & Sublingual where velocity is expanding, rebalance exposure to Vapor Pens where share remains 37.34% but is shrinking, and use Beverage’s steady 21.85% share as a MoM stabilizer to cushion volatility.
Competitive Landscape
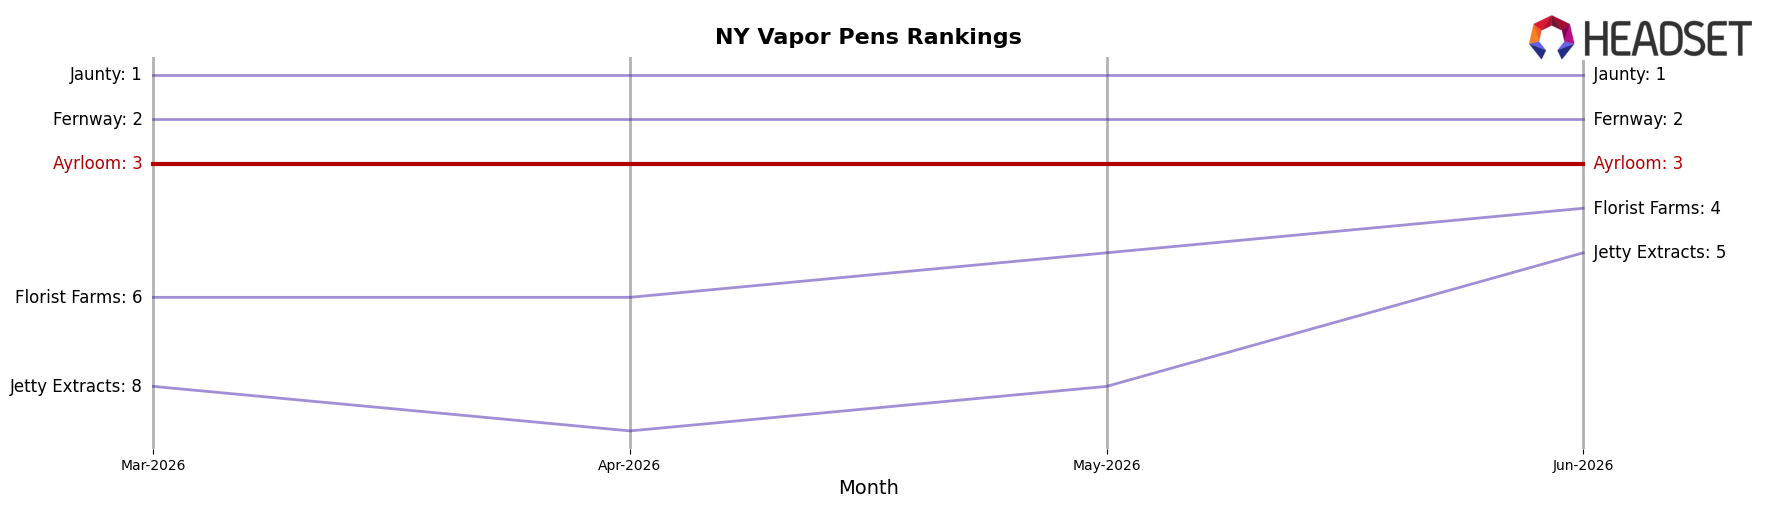
Ayrloom ranks #3 in NY Vapor Pens in June 2026, slipping 1 place year over year from #2 while holding flat versus March 2026 at #3; the brand previously peaked at #1 in December 2024, marking a 2-position gap from its high-water mark. In contrast, Jaunty held #1 year over year despite a 18.1% sales decline, and Fernway advanced from #3 to #2 with 40.0% YoY growth, indicating Ayrloom’s relative position is pressured by faster climbers even as the category leader contracts. The combination of Ayrloom’s -1 rank shift YoY and Fernway’s +1 rise implies that Ayrloom’s trajectory points to a defense phase rather than a recovery toward the #1 peak, unless it can convert share against a weakening #1.
Notable Products
The steepest decline came from CBD/THC 1:2 Yuzu Citrus Sparkling Water (5mg CBD, 10mg THC, 12oz), down 36.9% MoM at rank 10, while CBD/THC 1:2 Half & Half Lemonade Iced Tea UP (5mg CBD, 10mg THC, 12oz) also slipped 17.7% to rank 3; together these drops contrast with CBD/THC 1:2 Lemonade Up (5mg CBD, 10mg THC, 12oz) rising 23.7% at rank 6. Across the leaderboard, the top two SKUs moved in opposite directions, with CBD/THC 1:2 Up Honeycrisp Apple Cider (5mg CBD, 10mg THC, 12oz) easing 3.5% at rank 1 while CBD/THC 1:2 Black Cherry Sparkling Water (5mg CBD, 10mg THC, 12oz) grew 8.3% at rank 2, indicating share is shifting within the leading tier. Eight of the top ten are Beverage SKUs, and category breadth spans sparkling waters, sodas, and ciders with Root Beer up 4.7% at rank 4 and Orange Creamsicle Up Soda up 6.7% at rank 5, implying Ayrloom is concentrating on flavor variety to balance volatility in individual SKUs.
Top Selling Cannabis Brands
Data for this report comes from real-time sales reporting by participating cannabis retailers via their point-of-sale systems, which are linked up with Headset’s business intelligence software. Headset’s data is very reliable, as it comes digitally direct from our partner retailers. However, the potential does exist for misreporting in the instance of duplicates, incorrectly classified products, inaccurate entry of products into point-of-sale systems, or even simple human error at the point of purchase. Thus, there is a slight margin of error to consider. Brands listed on this page are ranked in the top twenty within the market and product category by total retail sales volume.

