Jun-2026
Sales
Trend
6-Month
Product Count
SKUs
Avg Price
YoY Sales Change
YoY Price Change
Market Insights Snapshot
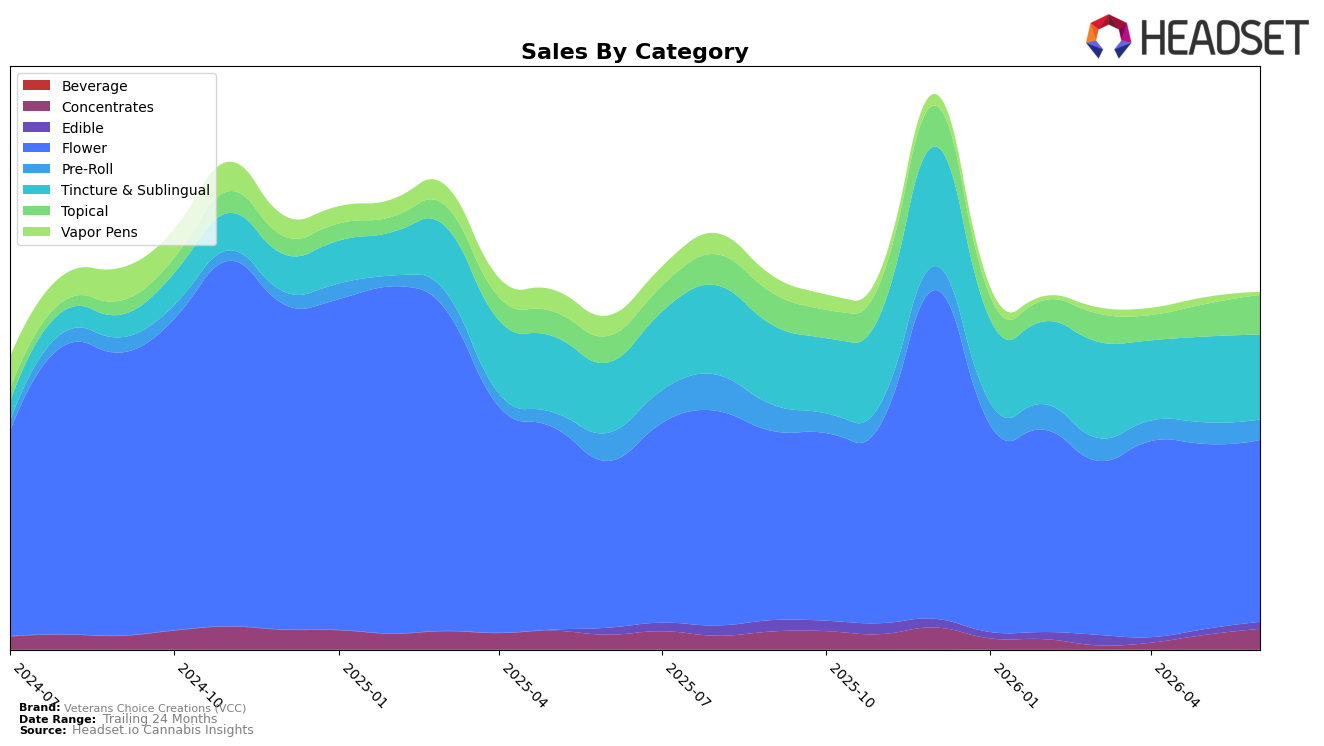
In June 2026, Veterans Choice Creations (VCC) concentrated 51.09% of sales in Flower with a 9.07% YoY gain but a -1.80% MoM dip, while Tincture & Sublingual held 23.80% share with 20.84% YoY growth and a -0.89% MoM slide; this split positions Flower as volume anchor while Tincture & Sublingual supplies the faster YoY lift. Topical expanded to 11.07% share with 50.00% YoY and 22.71% MoM growth, and Concentrates, though only 5.76% share, surged 39.05% YoY and 42.39% MoM, contrasting with Pre-Roll at 5.68% share, down -27.44% YoY and -5.15% MoM, and Vapor Pens at 0.74% share, down -86.90% YoY and -59.78% MoM; together these shifts imply a pivot away from inhalable commoditized formats toward wellness and value-dense form factors that are sustaining overall brand sales up 7.08% YoY despite a -4.89% 24‑month slide.
The category mix change implies VCC is migrating its positioning toward higher-margin, needs-based formats: Topical’s 22.71% MoM and Concentrates’ 42.39% MoM spikes, alongside a 4.80% YoY increase in average price to $53.71, suggest pricing power where efficacy is prioritized, while Flower’s -1.80% MoM and Pre-Roll’s -5.15% MoM indicate pullback from convenience-driven SKUs. With Flower still the top category yet ranked 48 in New York, the 9.07% YoY growth there is not translating into relative rank gains, so the accelerating shares in Topical (11.07%) and Concentrates (5.76%) should be leveraged to differentiate beyond price-sensitive Flower and Pre-Roll segments.
Competitive Landscape
Veterans Choice Creations (VCC) sits at rank #48 in NY Flower for June 2026, improving 1 position from #49 year over year and up 2 spots from #50 three months ago, while still far below its peak at #16 in June 2024; meanwhile, Find. climbed from #3 to #1 with a 35.6% YoY sales increase and Leal moved from #7 to #2 with 44.4% YoY growth, indicating category leaders are consolidating share as Dank. By Definition slipped from #1 to #3 alongside a 50.7% YoY sales decline and Rolling Green Cannabis fell from #2 to #4 with a 7.1% YoY contraction; this mix of upward and downward competitor mobility, combined with VCC’s marginal rank gain, implies VCC is stabilizing off a low base but not yet recapturing the mid-tier trajectory established at #16.

Notable Products
The steepest decline came from Lil Buddies Pre-Roll 10-Pack (5g), down 23.3% MoM and sliding to rank 6, while Spacebuds - Strawberry Slushie Moonrocks (4g) rose 16.6% to rank 1. Spacebuds - Grape Bubbly Moonrocks (4g) added 6.3% MoM at rank 2 as the Spacebuds Ballers- Blueberry Muffin Moonrocks (28g) gained 6.5% at rank 10, concentrating three of the top ten in Flower. CBD/THC 1:1 Warrior Balm (900mg CBD, 900mg THC, 30ml) advanced 19.1% MoM at rank 4, contrasting with a 9.4% MoM dip for CBD/THC/CBG Serenity Tincture (3000mg CBD, 300mg THC, 500mg CBG, 30ml) at rank 7, and the Hybrid FECO Syringe Applicator (1g) climbed 27.8% to rank 5 with $21,646 in sales. The pattern implies Veterans Choice Creations (VCC) is tilting mix toward high-THC experiential Flower and efficacious alt-forms while deprioritizing value multi-pack Pre-Rolls.
Top Selling Cannabis Brands
Data for this report comes from real-time sales reporting by participating cannabis retailers via their point-of-sale systems, which are linked up with Headset’s business intelligence software. Headset’s data is very reliable, as it comes digitally direct from our partner retailers. However, the potential does exist for misreporting in the instance of duplicates, incorrectly classified products, inaccurate entry of products into point-of-sale systems, or even simple human error at the point of purchase. Thus, there is a slight margin of error to consider. Brands listed on this page are ranked in the top twenty within the market and product category by total retail sales volume.

