Jun-2026
Sales
Trend
6-Month
Product Count
SKUs
Avg Price
YoY Sales Change
YoY Price Change
Market Insights Snapshot
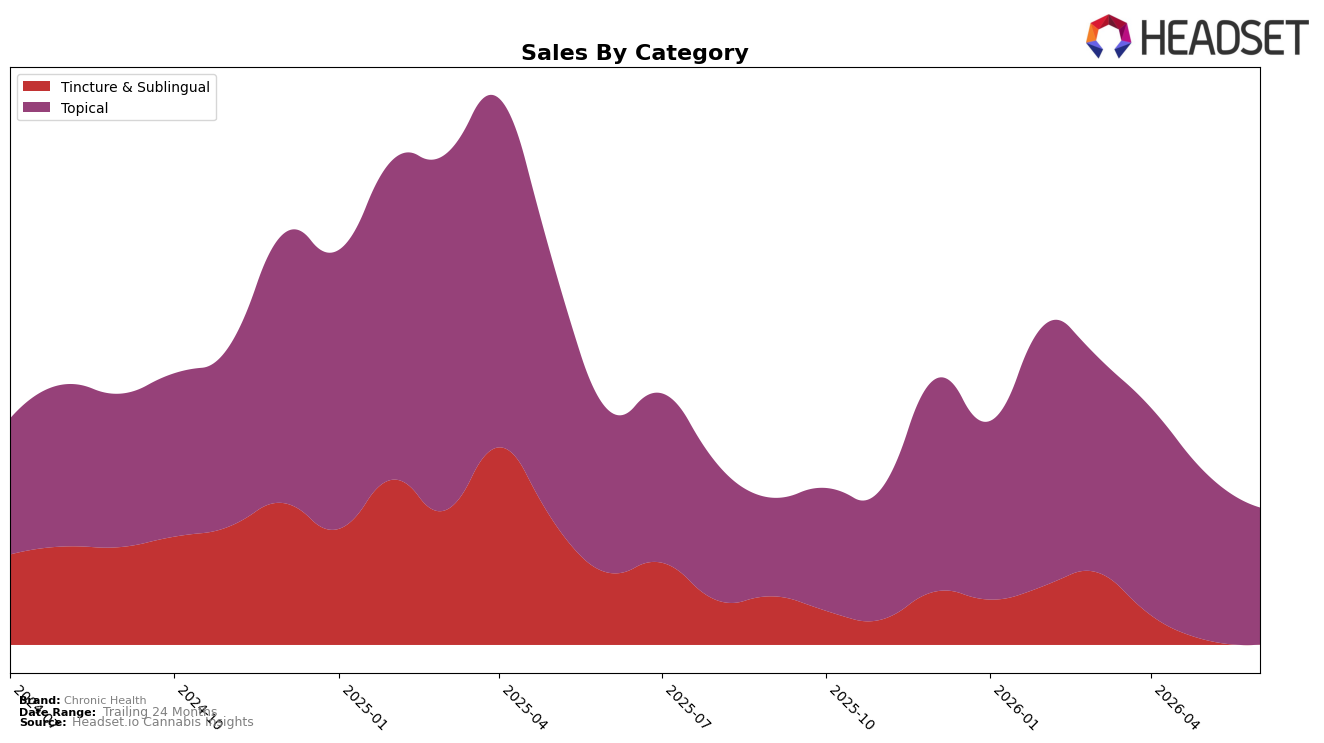
In June 2026, Chronic Health derived 68.97% of sales from Topical with a year-over-year decline of 9.31% and a month-over-month decline of 11.00%, while Tincture & Sublingual accounted for 31.03% with a 39.14% year-over-year drop and a 4.18% month-over-month decline. The brand’s average price rose 8.93% year over year to $20.34, with Topical averaging 25.66 and Tincture & Sublingual at 13.93, indicating mix and pricing are pulling in opposite directions as overall brand sales fell 21.28% year over year; the pattern implies a reliance on Topical for scale even as both categories contract at different rates, concentrating risk in a shrinking anchor.
Chronic Health’s #2 Topical rank in Arizona contrasts with a 10.996% month-over-month Topical decline and a 39.14% year-over-year contraction in Tincture & Sublingual, suggesting the brand competes on depth within Topical while ceding ground in the secondary format. With Topical’s share rising to 68.97% as Tincture & Sublingual weakens and brand sales falling 28.86% over 24 months, the June 2026 mix signals a defensive positioning centered on Topical leadership in Arizona that limits diversification and heightens exposure to category-specific headwinds.
Competitive Landscape
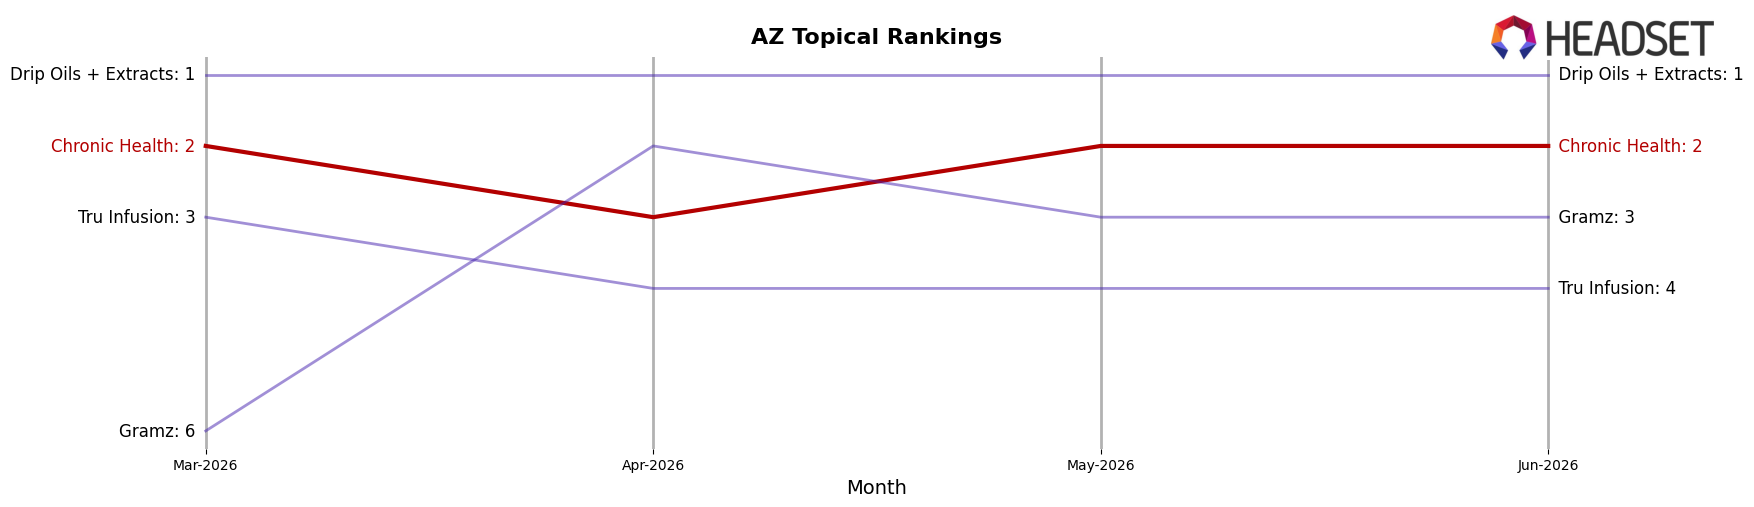
Chronic Health sits at rank #2 in AZ Topical in June 2026, unchanged year over year from #2, and it has held #2 for the past three months while previously peaking at #1 in March 2025; in contrast, Drip Oils + Extracts remains #1 year over year and in June 2026, and Gramz moved up from #7 to #3 with a 196.8% YoY sales increase. With Tru Infusion steady at #4 year over year and in June 2026 while Müv / MUV slipped from #6 to #5 alongside a 3.1% YoY sales decline, the flat #2 position for Chronic Health against a climbing #3 and a static #1 implies the brand is locked in a stable share corridor where incremental gains are required to reclaim its March 2025 #1 peak.
Notable Products
THC Pain Relief Lotion (100mg) posted the steepest decline in June 2026 at -36.3% and slid to rank 6, while the CBD/THC 1:1 Pain Relief Ointment (350mg CBD, 350mg THC, 4oz) fell -22.2% at rank 5. At the top, Indica THC Glycerin Tincture (100mg THC, 1oz) held rank 1 despite an -8.9% MoM dip, and the CBD/THC 1:1 Sleep Well Tincture (100mg CBD, 100mg THC, 1oz) sat at rank 2 with a -3.9% change. With eight of the top ten coming from Topical and only two from Tincture & Sublingual, the mix points to reliance on pain relief formats even as Tinctures anchor the highest ranks, implying a need to stabilize Topical demand to protect category breadth.
Top Selling Cannabis Brands
Data for this report comes from real-time sales reporting by participating cannabis retailers via their point-of-sale systems, which are linked up with Headset’s business intelligence software. Headset’s data is very reliable, as it comes digitally direct from our partner retailers. However, the potential does exist for misreporting in the instance of duplicates, incorrectly classified products, inaccurate entry of products into point-of-sale systems, or even simple human error at the point of purchase. Thus, there is a slight margin of error to consider. Brands listed on this page are ranked in the top twenty within the market and product category by total retail sales volume.

