Jun-2026
Sales
Trend
6-Month
Product Count
SKUs
Avg Price
YoY Sales Change
YoY Price Change
Market Insights Snapshot
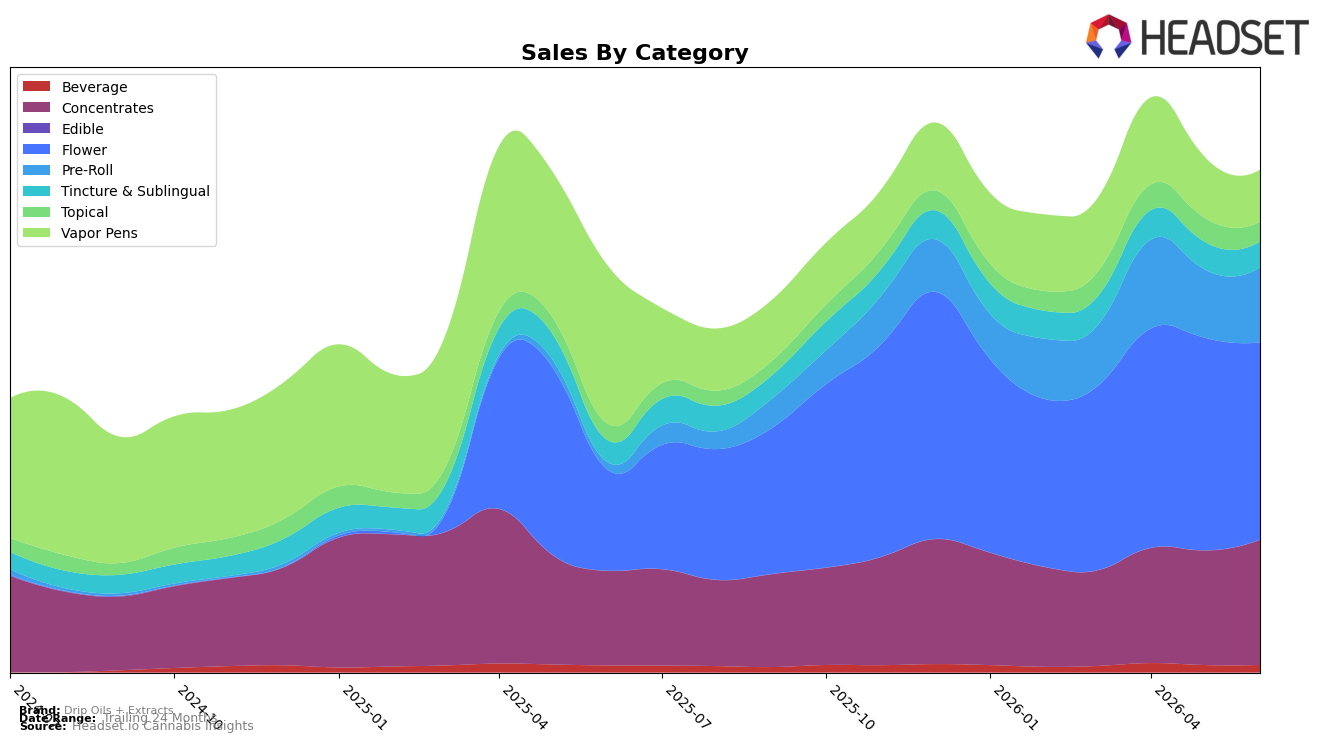
Drip Oils + Extracts shifted its mix in June 2026 toward higher-growth combustion formats: Flower held 39.29% share with 96.21% year-over-year growth but declined 7.27% month-over-month, while Pre-Roll expanded to 14.92% share with 923.51% year-over-year growth and a 9.73% month-over-month gain. Concentrates reached 24.93% share on 32.54% year-over-year growth and 9.25% month-over-month growth, whereas Vapor Pens fell to 10.38% share with a 66.99% year-over-year decline and a 14.32% month-over-month drop. Ancillary formats were mixed: Tincture & Sublingual grew 17.66% year-over-year but slipped 6.01% month-over-month to 5.13% share, and Topical rose 18.86% year-over-year but fell 18.61% month-over-month to 3.87% share. The overall pattern points to a deliberate reweighting away from declining Vapor Pens toward Pre-Roll and Concentrates, using Flower as a volatile but growing anchor, which implies June’s dip in Flower was absorbed by gains in adjacent inhalable formats.
Pricing and positioning signals reinforce a value-to-volume pivot: the brand’s average price decreased 16.97% year-over-year to $21.64 while brand sales grew 23.86% year-over-year, consistent with mix-shift elasticity where Pre-Roll (+923.51% YoY, +9.73% MoM) and Concentrates (+32.54% YoY, +9.25% MoM) capture incremental units as Vapor Pens contracts (-66.99% YoY, -14.32% MoM). With Flower still the top category at 39.29% share but down 7.27% month-over-month, the concurrent month-over-month gains in Pre-Roll and Concentrates suggest substitution rather than category exit. In Arizona Flower, a rank of 15 indicates mid-pack visibility; paired with the brand’s 96.55% two-year growth and a 1.80% month-over-month uptick in Beverage against a small 1.49% share, the mix implies a strategy to secure baseline velocity in mainstream inhalables while testing smaller adjacency bets to buffer rank volatility.
Competitive Landscape
Drip Oils + Extracts sits at rank #15 in AZ Flower in June 2026, improving 12 places year over year from #27, but only 1 place versus March 2026 when it was #16; compared with a peak of #10 in December 2025, the current position is 5 ranks lower, indicating partial recovery rather than a return to peak. Competitive pressure is evident as Just Flower held #1 with a 13.0% YoY sales increase and The Pharm rose from #5 to #4 on 44.1% YoY growth, while Mohave Cannabis Co. stayed #3 despite a -13.9% YoY decline; by contrast, Brown Bag advanced from #7 to #5 with 72.8% YoY growth. The pattern implies that Drip Oils + Extracts’ rank trajectory—up 12 places YoY but still 5 below its December 2025 peak—points to mid-pack momentum that will require share capture from faster-climbing rivals to sustain further rank gains.

Notable Products
The steepest decline came from CBD/CBG 1:1 Hemp Salve (500mg CBD, 500mg CBG), down 16.2% month over month at rank 6, while Gelonade Pre-Roll (0.5g) rose 22.0% to rank 4, indicating wellness-oriented SKUs are cooling as inhalables firm up. High THC RSO Syringe (1g) held rank 1 with a 7.1% MoM gain, and three Flower SKUs sit within the top 10 at ranks 2, 5, and 10, concentrating share in inhalable formats over non-inhalables. With Flower clustered near the top and pre-roll momentum outpacing Topicals by 38.2 percentage points, the mix points to prioritization of inhalables and potency-forward items over CBD-led wellness for June 2026.
Top Selling Cannabis Brands
Data for this report comes from real-time sales reporting by participating cannabis retailers via their point-of-sale systems, which are linked up with Headset’s business intelligence software. Headset’s data is very reliable, as it comes digitally direct from our partner retailers. However, the potential does exist for misreporting in the instance of duplicates, incorrectly classified products, inaccurate entry of products into point-of-sale systems, or even simple human error at the point of purchase. Thus, there is a slight margin of error to consider. Brands listed on this page are ranked in the top twenty within the market and product category by total retail sales volume.

