Jun-2026
Sales
Trend
6-Month
Product Count
SKUs
Avg Price
YoY Sales Change
YoY Price Change
Market Insights Snapshot
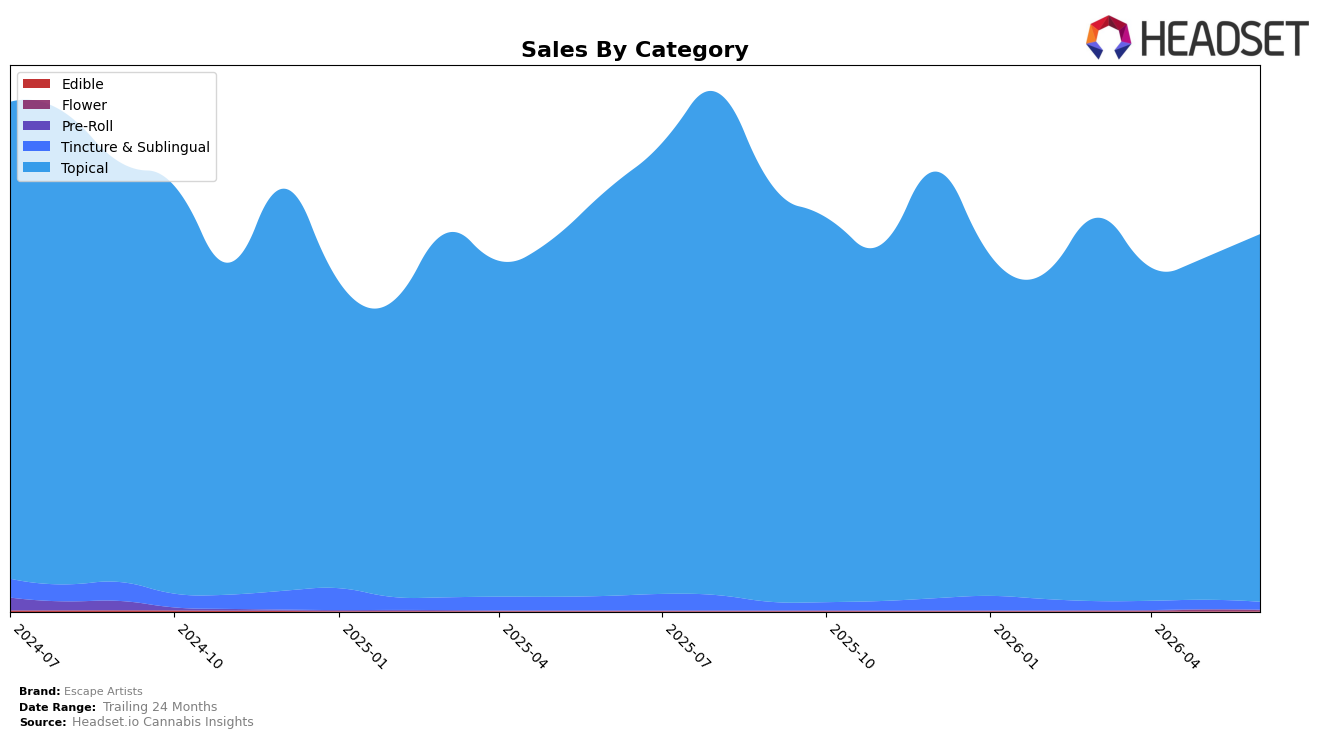
In June 2026, Escape Artists derived 97.83% of sales from Topical, up 7.50% month over month despite a 9.67% year-over-year decline, while Tincture & Sublingual fell 17.34% MoM and 47.50% YoY to 1.96% share; Flower contracted 35.75% MoM to just 0.21% share with no established YoY baseline. The brand’s average price rose 6.61% YoY to $58.27 as total brand sales declined 10.75% YoY, indicating that the 7.50% MoM lift in its core Topical segment offset only part of broader softness across smaller formats. The pattern implies Escape Artists is consolidating around Topical momentum month over month while ceding breadth in Tincture & Sublingual and Flower, concentrating risk but also reinforcing the category where it is most active.
Given a Colorado Topical rank of 1 alongside a 97.83% sales concentration in Topical and a 7.50% MoM gain there versus a 17.34% MoM drop in Tincture & Sublingual, the brand’s positioning is skewing further toward specialty leadership rather than portfolio balance. With total sales down 10.75% YoY even as pricing climbed 6.61% YoY, mix and unit velocity within Topical are the decisive levers, and shrinking exposure to Tincture & Sublingual (1.96% share, down 47.50% YoY) and Flower (0.21% share, down 35.75% MoM) implies a strategy where maintaining rank in Colorado Topical takes precedence over rebuilding secondary categories.
Competitive Landscape
Escape Artists sits at rank #1 in CO Topical in June 2026, unchanged from #1 in June 2025, and it also held #1 three months ago, signaling zero rank volatility alongside a 0-position year-over-year shift; meanwhile, Mary Jane's Medicinals holds #2 after moving up from #3 while posting a -4.1% YoY sales change, and Nordic Goddess is #3 after improving from #4 despite a -32.2% YoY decline, indicating that Escape Artists’ static #1 rank is being maintained as competitors advance in rank but recede in sales. With Care Division at #4 from #5 on a -31.5% YoY trend and Highly Edible at #5 from #7 on +19.9% YoY growth, the pattern implies Escape Artists’ sustained #1 position is anchored more by relative competitor contraction than by rank gains, pointing to a defensive moat that could narrow if growth-positive challengers keep climbing.

Notable Products
CBD/CBG/THC 2:1:2 Lavender Relief Cream (400mg CBD, 200mg CBG, 400mg THC, 2oz) posted the steepest decline at -27.5% month over month and slipped to rank 5, while CBD/CBG/THC 8:1:1 Menthol Relief Cream Tube (800mg CBD, 100mg CBG, 100mg THC, 2oz) climbed 43.8% to rank 3. At the top, CBD/CBG/CBN/THC 5:1:1:5 Eucalyptus + Lavender Relief Cream (1250mg CBD, 250mg CBG,250mg CBN, 1250mg THC) grew 24.2% to hold rank 1, and the CBD/CBG/THC 2:1:2 Cedar & Black Pepper Relief Cream (800mg CBD, 400mg CBG, 800mg THC, 2oz) added 10.2% at rank 2, together accounting for $326,310 in June 2026. Eight of the top ten are Topical Relief Cream SKUs, indicating the lineup is concentrated in pain-relief formats rather than novel form factors like the CBD/THC 3:1 Eucalyptus & Lavender Bath Bomb, which rose 29.5% at rank 6. The pattern implies Escape Artists is leaning into higher-potency and mentholated relief creams while pruning or repositioning softer-aroma variants as consumer preference consolidates around fast-acting topical solutions.
Top Selling Cannabis Brands
Data for this report comes from real-time sales reporting by participating cannabis retailers via their point-of-sale systems, which are linked up with Headset’s business intelligence software. Headset’s data is very reliable, as it comes digitally direct from our partner retailers. However, the potential does exist for misreporting in the instance of duplicates, incorrectly classified products, inaccurate entry of products into point-of-sale systems, or even simple human error at the point of purchase. Thus, there is a slight margin of error to consider. Brands listed on this page are ranked in the top twenty within the market and product category by total retail sales volume.

