.svg)

Sep-2026
Sales
Trend
6-Month
Product Count
SKUs
Avg Price
YoY Sales Change
YoY Price Change


Where to Buy
Mary Jane's Medicinals is stocked at 138 licensed dispensaries across Colorado, Nevada, and Oklahoma, 136 of them in Colorado, with the deepest coverage in Denver, Colorado Springs, Aurora, Boulder, and Durango. Search by ZIP code or city below to find the closest one, or filter by product type if you are after a specific format.
Market Insights Snapshot
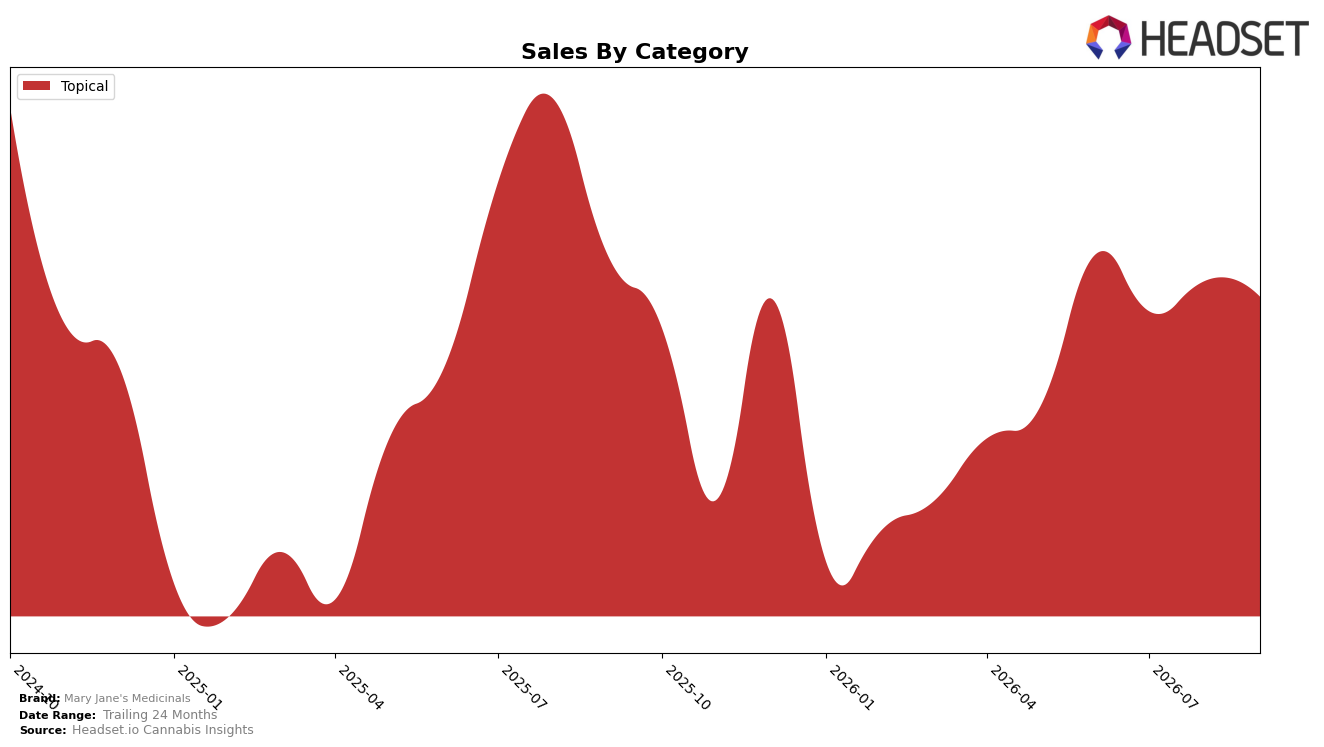
In September 2026, Mary Jane's Medicinals operated a single-category mix in Topical at 100.0% share, with year-over-year sales down 4.26% and month-over-month sales down 1.68%. Average price rose 20.68% year over year to $51.95 while the brand’s overall sales contracted 4.26%, indicating a volume drag despite price expansion. With Topical concentrated entirely in Colorado and holding rank position 2 in the category, the static category mix combined with negative YoY and MoM sales implies reliance on pricing to offset volume softness, not assortment breadth.
The shift toward higher average price alongside a 4.26% YoY sales decline and a 1.68% MoM dip suggests price elasticity pressure within Topical, while the 24-month sales change of -10.80% and a category rank of 2 point to entrenched placement rather than expansion. Because 100.0% of sales sit in a single category and Colorado is the top state context for that category rank, the mix concentrates risk; the pattern implies that maintaining a top-2 slot will depend more on stabilizing unit velocity than on additional price increases.
Competitive Landscape
Mary Jane's Medicinals is ranked #2 in Colorado Topical in September 2026, unchanged from #2 year over year, and also flat versus three months ago at #2, while Escape Artists holds #1 with a -1.3% year-over-year sales change and Nordic Goddess sits at #3 with a -19.4% decline, indicating Mary Jane's Medicinals is stable relative to a contracting tier behind and a minimally slipping leader ahead; with My Brother's Flower improving rank from #5 to #4 despite a -24.4% sales change and Care Division dropping from #4 to #5 on a -54.9% decline, the brand’s unchanging #2 across year-over-year and three-month views implies a defended position that benefits from competitor deterioration but requires share capture from #1 to convert stability into upward movement.

Notable Products
CBD Pain Relief Salve (120mg CBD, 3.3oz) posted the largest month-over-month surge at +59.3% while holding rank 4, whereas CBD/CBG/CBC/THC 5:1:1:5 Super Strength Nano Salve (500mg CBD, 100mg CBG, 100mg CBC, 500mg THC, 3.3oz) fell -69.4% to rank 10. CBD/THC 1:1 Nano Salve (45mg CBD, 45mg THC, 0.3oz) also declined -39.2% at rank 5, indicating volatility concentrated in smaller-format nanos while larger-format salves gained share; this pattern implies Mary Jane's Medicinals is migrating demand toward higher-dosage, full-size topicals rather than compact nano variants.
At the top, CBD/CBG/THC 10:1:10 Ultra Strength Maxx 6000 Salve (3000mg CBD, 300mg CBG, 3000mg THC, 3oz) rose +117.5% to rank 1 with about $61,489 in September 2026, while CBD/THC 1:1 Super Strength Salve (500mg CBD, 500mg THC, 3.3oz) advanced +42.1% at rank 2. With all top-10 items in the Topical category and three salves occupying ranks 1–4, the concentration points to premium salves as the revenue engine; this implies a product strategy that leans into ultra- and super-strength salves to capture repeat therapeutic use over novelty formats.
Top Selling Cannabis Brands






Data for this report comes from real-time sales reporting by participating cannabis retailers via their point-of-sale systems, which are linked up with Headset’s business intelligence software. Headset’s data is very reliable, as it comes digitally direct from our partner retailers. However, the potential does exist for misreporting in the instance of duplicates, incorrectly classified products, inaccurate entry of products into point-of-sale systems, or even simple human error at the point of purchase. Thus, there is a slight margin of error to consider. Brands listed on this page are ranked in the top twenty within the market and product category by total retail sales volume.

