Jun-2026
Sales
Trend
6-Month
Product Count
SKUs
Avg Price
YoY Sales Change
YoY Price Change
Market Insights Snapshot
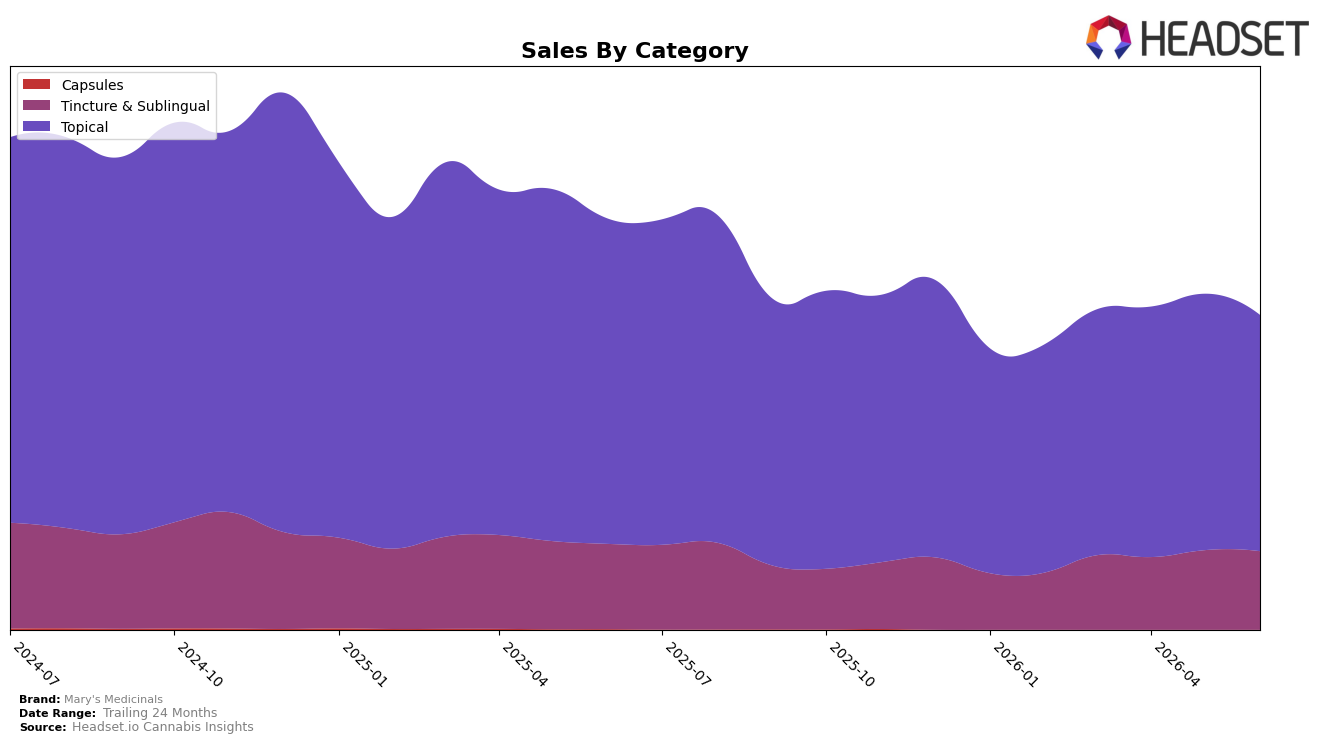
Mary's Medicinals concentrated 75.10% of June 2026 sales in Topical while Tincture & Sublingual held 24.90%, a mix that tightened as Topical declined 27.38% year over year and 7.87% month over month, versus smaller contractions of 7.81% YoY and 1.28% MoM in Tincture & Sublingual. Despite an average price rising 9.04% year over year to $27.18, overall brand sales fell 23.44% YoY and 33.98% over 24 months, with Topical’s average price at $26.51 and Tincture & Sublingual at $29.44. The pattern implies overexposure to a shrinking Topical base is pulling aggregate performance down faster than price could offset, while the relatively milder declines in Tincture & Sublingual signal a stabilizer that still lacks sufficient scale to counter Topical drag.
With Topical anchoring the mix at 75.10% but dropping 27.38% YoY, the brand’s positioning leans on a category where elasticity or demand softness is outpacing the 9.04% brand-level price increase, whereas Tincture & Sublingual’s 7.81% YoY decline and 1.28% MoM dip present a comparatively steadier lane. Holding rank 1 in Topical in Missouri while Topical share is shrinking month over month by 7.87% suggests leadership is not insulating against volume risk; reallocating emphasis toward the 24.90% Tincture & Sublingual base and moderating Topical price mix could reduce volatility and align positioning with the category that is contracting less quickly.
Competitive Landscape
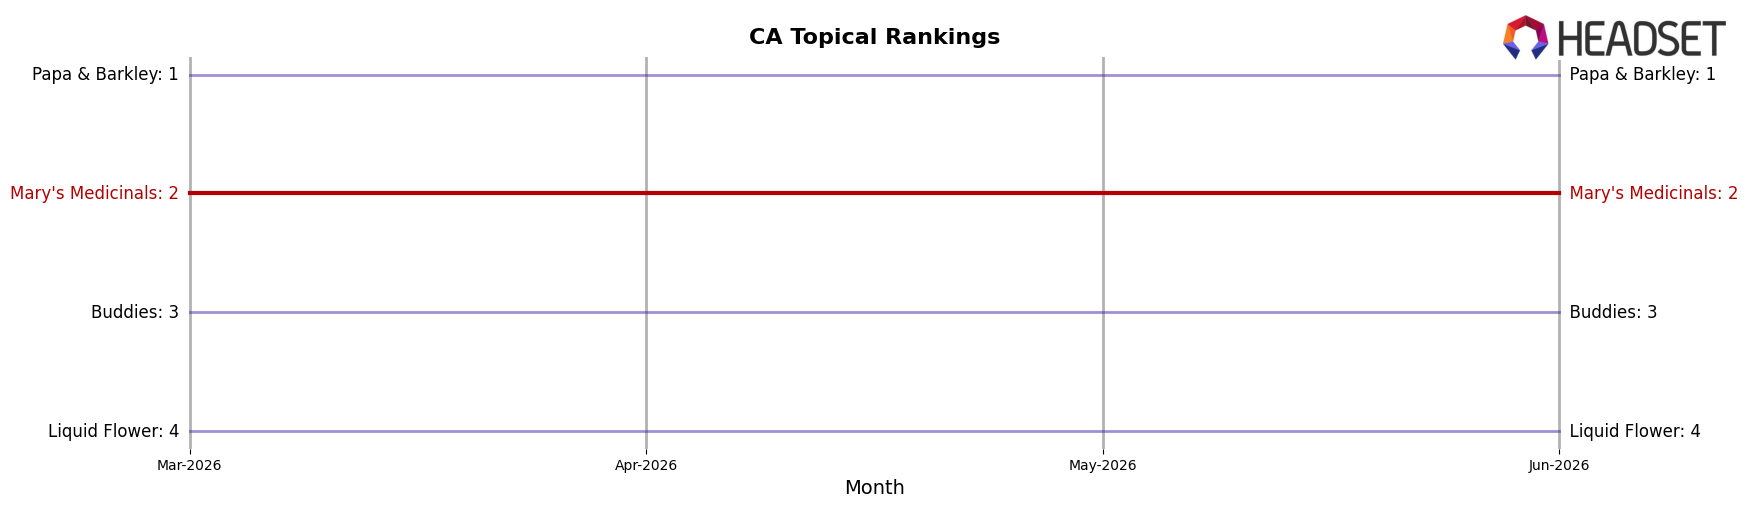
Mary's Medicinals sits at rank #2 in CA Topical in June 2026, unchanged from #2 in June 2025, with its peak rank of #2 also occurring in June 2026, while the brand held #2 three months ago as well—this flat rank trajectory contrasts with Papa & Barkley holding #1 year over year despite a -4.6% sales YoY change and Liquid Flower climbing from #6 to #4 on +58.7% YoY sales; meanwhile, Carter's Aromatherapy Designs (C.A.D.) slid from #4 to #5 with -22.2% YoY sales while Buddies held #3 on +64.5% YoY sales, indicating that Mary's Medicinals’ stable #2 alongside upward and downward moves around it implies entrenched share but limited momentum to displace the #1 incumbent without a step-change in velocity.
Notable Products
Indica Relax Transdermal Patch (20mg) led the movement in June 2026 with a -22.8% month-over-month decline, dropping to rank 5 as CBD/THC/CBN 2:3:1 Formula Transdermal Patch (10mg CBD, 15mg THC, 5mg CBN) also slipped -13.7% while holding rank 1. Across the top ten, eight SKUs are Topicals, yet the CBD/THC 1:1 Recover Sandalwood Transdermal Cream (1000mg CBD, 1000mg THC, 2oz) fell -31.2% at rank 8 and the CBD/THC 1:1 Relief Transdermal Patch (10mg CBD, 10mg THC) eased -3.0% at rank 2, indicating softness concentrated inside the largest category. Meanwhile, the CBD/THC 1:1 Large Colling Action Relief Muscle Freeze (1000mg CBD, 1000mg THC, 3oz) in Topicals inched up +2.9% at rank 7 and The Remedy Relax Tincture (1000mg THC, 13.5ml) was nearly flat at -0.1% while ranking 3 with $67,874, pointing to selective resilience in non-patch formats. The pattern implies Mary's Medicinals is leaning toward diversified format balance, as patches lose momentum while creams and tinctures provide steadier volume.
Top Selling Cannabis Brands
Data for this report comes from real-time sales reporting by participating cannabis retailers via their point-of-sale systems, which are linked up with Headset’s business intelligence software. Headset’s data is very reliable, as it comes digitally direct from our partner retailers. However, the potential does exist for misreporting in the instance of duplicates, incorrectly classified products, inaccurate entry of products into point-of-sale systems, or even simple human error at the point of purchase. Thus, there is a slight margin of error to consider. Brands listed on this page are ranked in the top twenty within the market and product category by total retail sales volume.

