Jun-2026
Sales
Trend
6-Month
Product Count
SKUs
Avg Price
YoY Sales Change
YoY Price Change
Market Insights Snapshot
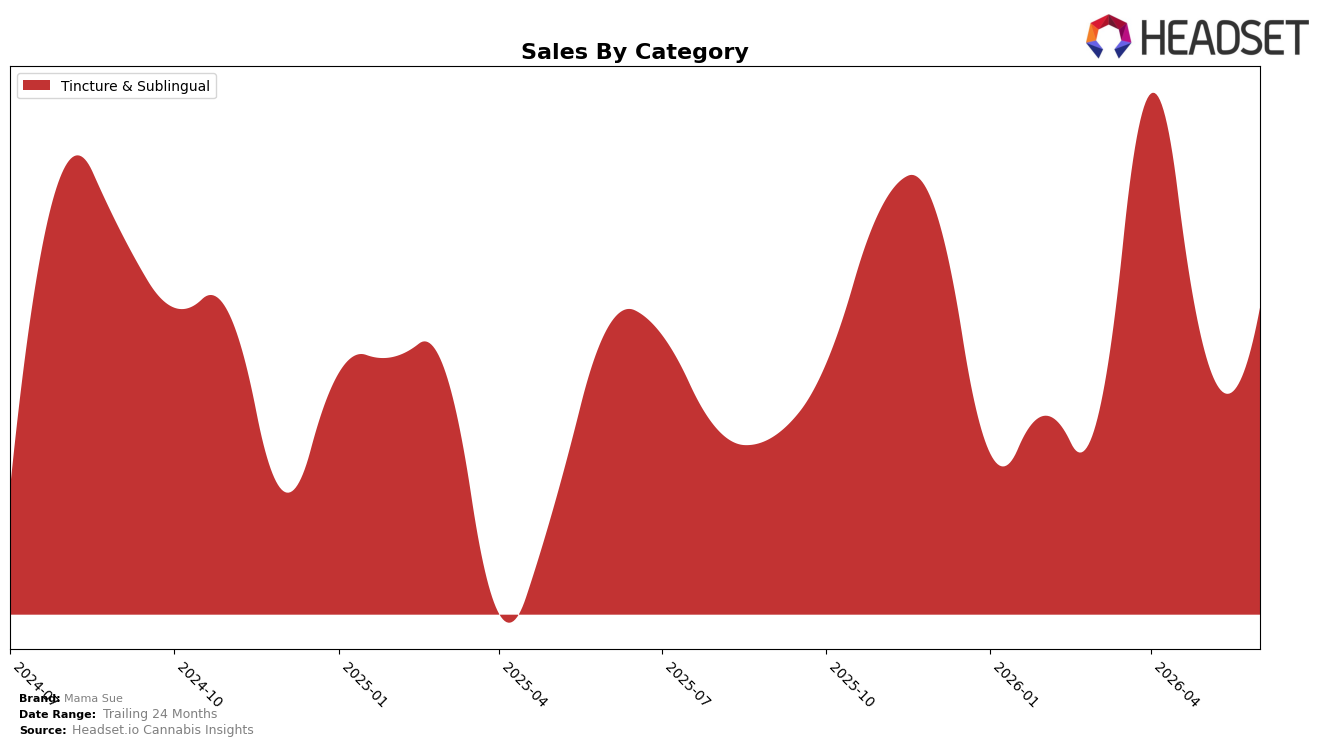
In June 2026, Mama Sue’s mix is entirely concentrated in Tincture & Sublingual at 100.0% share, with year-over-year sales up 3.88% and month-over-month up 9.22%. Average price rose 3.43% YoY to $30.54 while the category maintained full mix share at 100.0%, indicating volume (or mix within SKUs) contributed alongside price. With no rank reported in California Tincture & Sublingual and a single-category footprint, the pattern implies dependence on one format is amplifying short-term MoM gains but capping cross-category defensiveness.
The consolidation in Tincture & Sublingual—100.0% mix alongside 3.88% YoY growth and 9.22% MoM—implies positioning as a specialist rather than a portfolio balancer. The 3.43% YoY price increase paired with full-category reliance suggests pricing power is being tested within one lane, and the absence of a reported rank in California Tincture & Sublingual implies visibility hinges on deepening penetration in that segment rather than diversifying; the pattern points to resilience when the category is expanding MoM and exposure when it contracts YoY.
Competitive Landscape
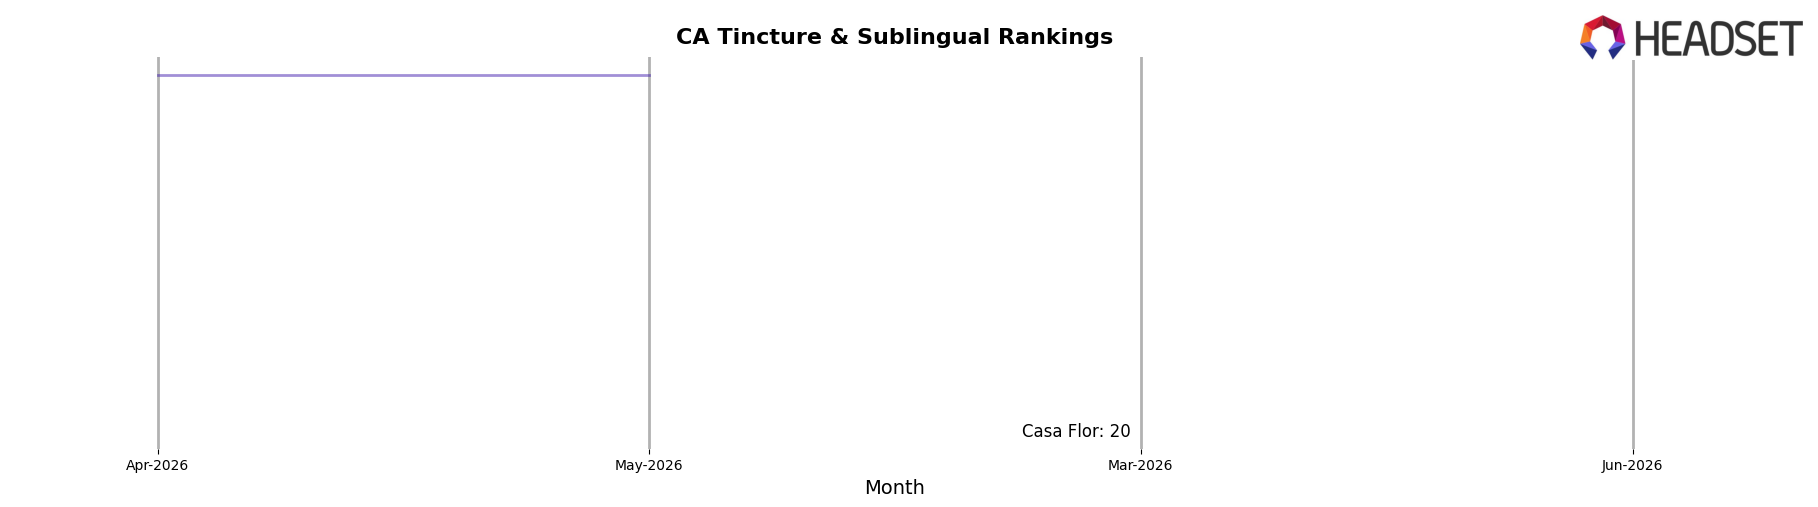
Mama Sue sits at rank #22 in CA Tincture & Sublingual for June 2026 with no year-over-year rank change from #22, and no three-month shift from #22, even after peaking at #19 in April 2026; this flat trajectory contrasts with Papa & Barkley holding #1 year over year while its sales declined 9.7%, and ABX / AbsoluteXtracts rising from #7 to #5 alongside a 10.3% sales increase, indicating that Mama Sue’s stable rank amid both top-tier contraction and mid-tier advancement implies the brand is neither capturing share from sliding leaders nor participating in the upward mobility seen among improving competitors.
Notable Products
CBD/CBN 1:1 Sleep Tincture (150mg CBD, 150mg CBN, 24mg THC, 15ml) led June 2026 with a 13.3% month-over-month rise and a rank of 1, while CBD/THC Full Spectrum Everyday Wellness Tincture (550mg CBD, 35mg THC, 15ml) slipped 2.5% and held rank 2. Both top SKUs sit in Tincture & Sublingual, concentrating 100% of the top-two positions and indicating a channel where incremental gains at the leader can coexist with slight softness in the follow-up. The pattern implies Mama Sue’s mix is consolidating around sleep-and-wellness tinctures, prioritizing depth in a single format over breadth across categories.
Top Selling Cannabis Brands
Data for this report comes from real-time sales reporting by participating cannabis retailers via their point-of-sale systems, which are linked up with Headset’s business intelligence software. Headset’s data is very reliable, as it comes digitally direct from our partner retailers. However, the potential does exist for misreporting in the instance of duplicates, incorrectly classified products, inaccurate entry of products into point-of-sale systems, or even simple human error at the point of purchase. Thus, there is a slight margin of error to consider. Brands listed on this page are ranked in the top twenty within the market and product category by total retail sales volume.

