Jun-2026
Sales
Trend
6-Month
Product Count
SKUs
Avg Price
YoY Sales Change
YoY Price Change
Market Insights Snapshot
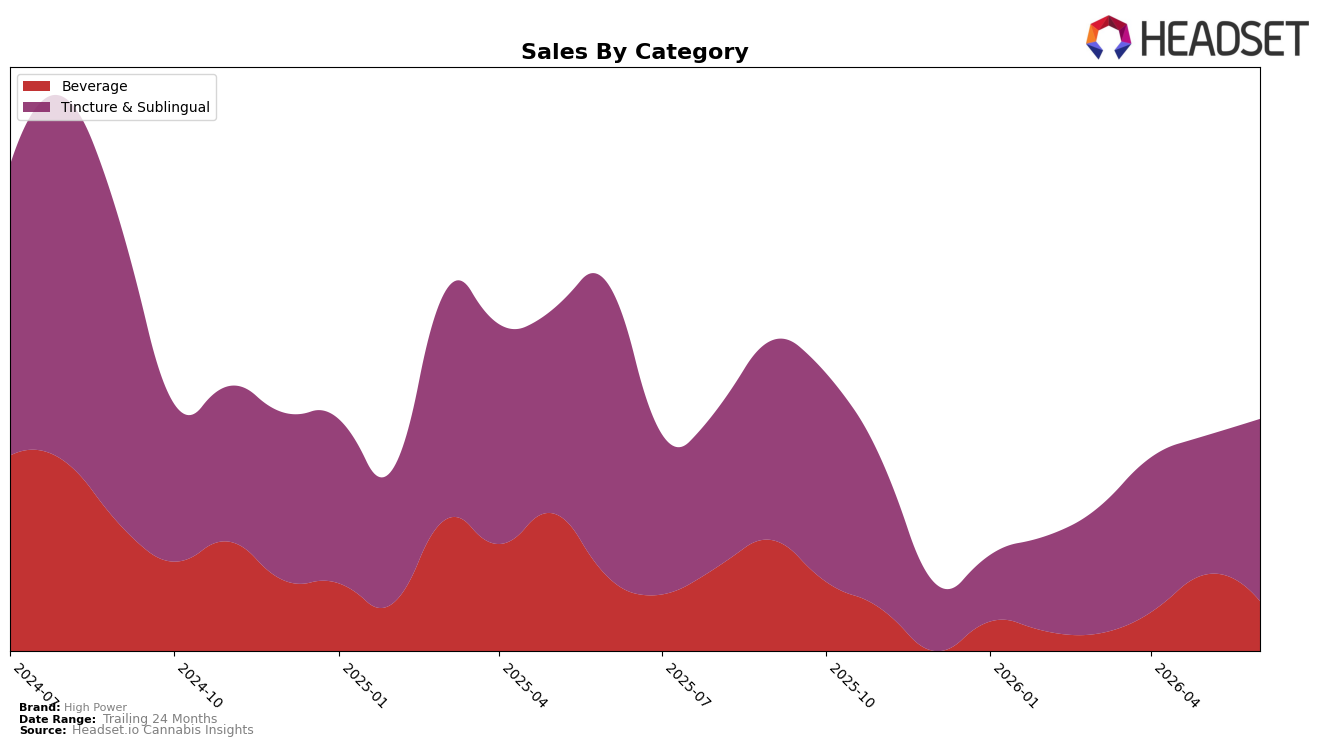
High Power’s category split in June 2026 concentrated 70.31% of brand sales in Tincture & Sublingual while Beverage held 29.69%, placing the brand in a two-pillar mix that moved unevenly month over month. Tincture & Sublingual rose 23.43% MoM despite a -32.68% YoY decline, while Beverage fell -21.48% MoM on a -19.80% YoY slide; paired with a -7.33% YoY drop in average price and a brand-level -29.31% YoY sales contraction, the tilt indicates volume stabilization is occurring inside the higher-share pillar even as the smaller pillar retrenches. With Tincture & Sublingual ranked 14 in California and averaging $23.16 versus Beverage at $22.53, the pattern implies a price-sensitive consumer mix where MoM gains are being captured primarily in the core category, elevating dependence on a single segment for near-term traction.
The divergence—Tincture & Sublingual adding 23.43% MoM share momentum against Beverage’s -21.48% MoM contraction, alongside YoY declines of -32.68% and -19.80% respectively—implies High Power is reinforcing a defensive posture around its ranked 14 Tincture & Sublingual franchise rather than balancing the portfolio. Given overall sales are down -29.31% YoY and average price is down -7.33% YoY, the mix shift suggests the brand’s pathway to recovery hinges on converting June 2026’s Tincture & Sublingual MoM volume uptick into sustained rank improvement in California while clarifying Beverage’s role to prevent incremental share loss from a 29.69% stake.
Competitive Landscape
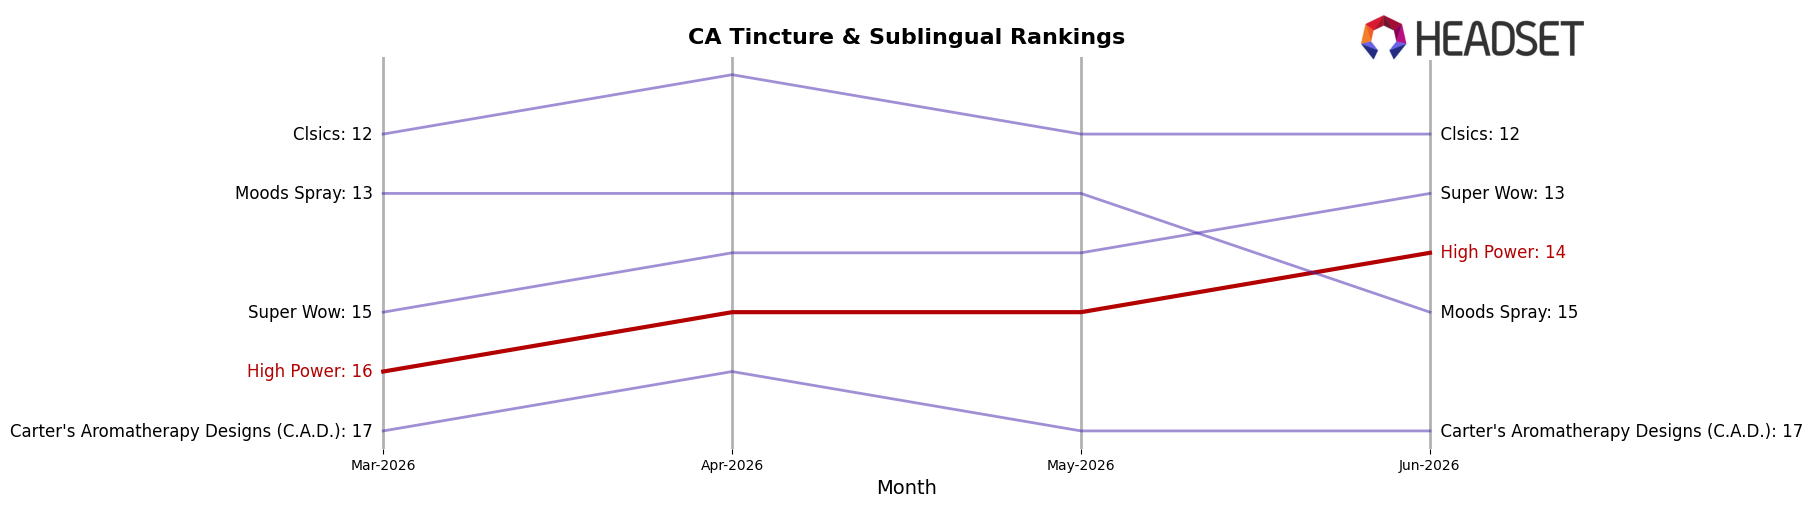
High Power sits at rank 14 in June 2026, sliding 2 positions year over year from rank 12 while improving 2 spots versus March 2026 when it was rank 16; against this flat-to-deteriorating placement, Papa & Barkley held rank 1 both year over year and in June 2026 despite a -9.7% sales YoY change, and ABX / AbsoluteXtracts climbed from rank 7 to rank 5 with a +10.3% YoY sales change, signaling that High Power’s drop from its peak rank 10 in September 2024 to 14 in June 2026, paired with competitors gaining or holding top positions, implies share is consolidating above it unless it converts the recent 2-rank quarterly lift into sustained gains.
Notable Products
The steepest movement came from Horchata Tincture 4-Pack (1000mg THC, 200ml), which fell 57.07% to rank 8 while Berry Syrup (250mg) dropped 32.39% at rank 3; in contrast, Watermelon Tincture (250mg THC, 50ml) surged 66.02% into a shared rank 5. Berry Tincture 4-Pack (1000mg THC, 200ml) inched up 8.83% to hold rank 1, while Watermelon Tincture 4-Pack (1000mg THC, 200ml) added 6.81% within rank 5, and Pineapple Breeze Tincture 4-Pack (1000mg THC, 200ml) rose 22.44% at rank 7. Seven of the top ten SKUs are Tincture & Sublingual, with the category’s mixed swings contrasting a 28.04% decline for Watermelon Syrup 4-Pack (1000mg) at rank 6 and cushioning beverage weakness around $4,634 in June 2026. The pattern implies High Power’s commercial direction is consolidating around multi-flavor tincture packs, using small-bottle spikes to backfill volatility while de-emphasizing syrups.
Top Selling Cannabis Brands
Data for this report comes from real-time sales reporting by participating cannabis retailers via their point-of-sale systems, which are linked up with Headset’s business intelligence software. Headset’s data is very reliable, as it comes digitally direct from our partner retailers. However, the potential does exist for misreporting in the instance of duplicates, incorrectly classified products, inaccurate entry of products into point-of-sale systems, or even simple human error at the point of purchase. Thus, there is a slight margin of error to consider. Brands listed on this page are ranked in the top twenty within the market and product category by total retail sales volume.

