.svg)
Sep-2026
Sales
Trend
6-Month
Product Count
SKUs
Avg Price
YoY Sales Change
YoY Price Change


Market Insights Snapshot
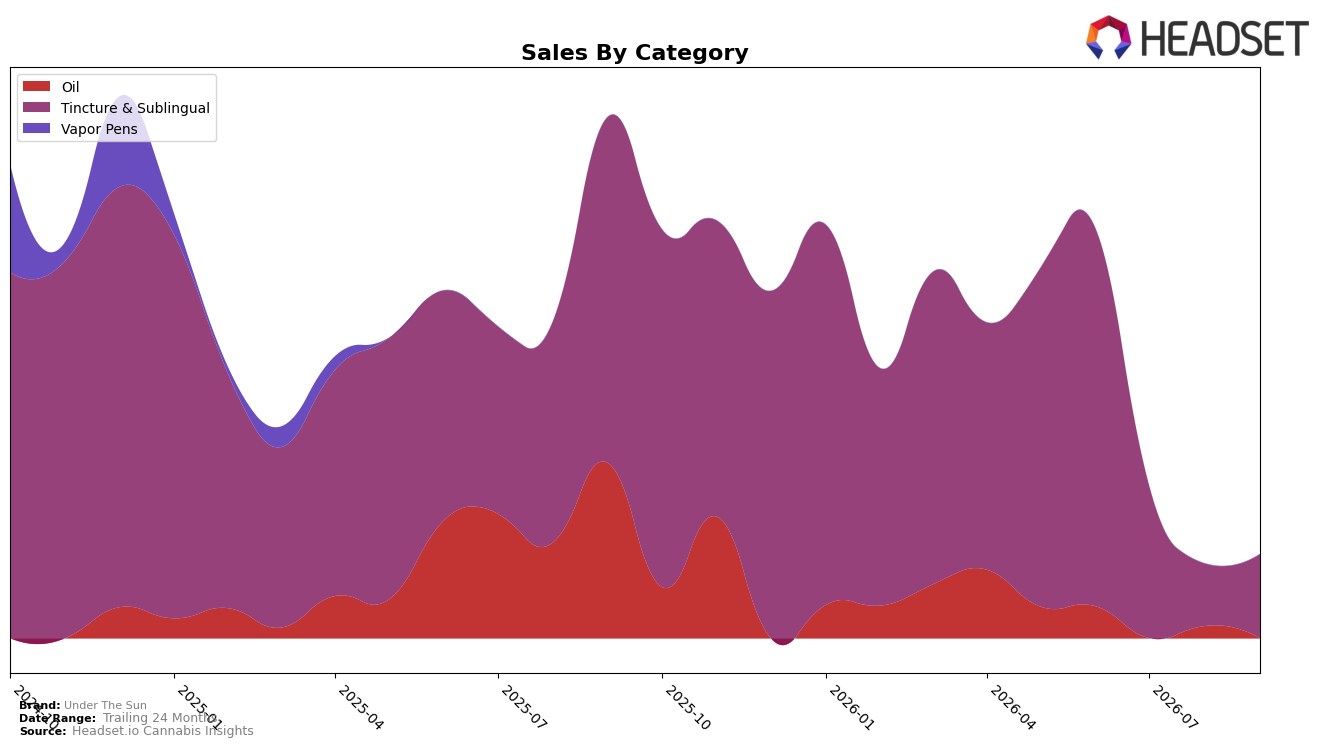
Under The Sun concentrated entirely in Tincture & Sublingual for September 2026, with category share at 100.0% and no other categories contributing, while brand sales fell 83.95% year over year and declined 76.25% over 24 months. Within that single category, year-over-year sales contracted 75.84% even as month-over-month sales rose 34.56%, and the average price decreased 8.09% to $35.09. The pattern implies a narrow, single-category footprint that is compressing on a yearly basis but staging a monthly rebound, indicating short-term re-engagement without diversification.
The 34.56% month-over-month lift alongside a 75.84% year-over-year decline indicates demand elasticity concentrated in one format rather than broad market pull, and the 8.09% price decrease coexisting with a 100.0% category share suggests price-led recovery attempts are confined to Tincture & Sublingual. With no published rank in Alberta and a 83.95% brand-level year-over-year drop, the mix and pricing shifts imply Under The Sun is repositioning as a value-seeking tincture specialist rather than a multi-format player, prioritizing depth in one niche over breadth.
Competitive Landscape
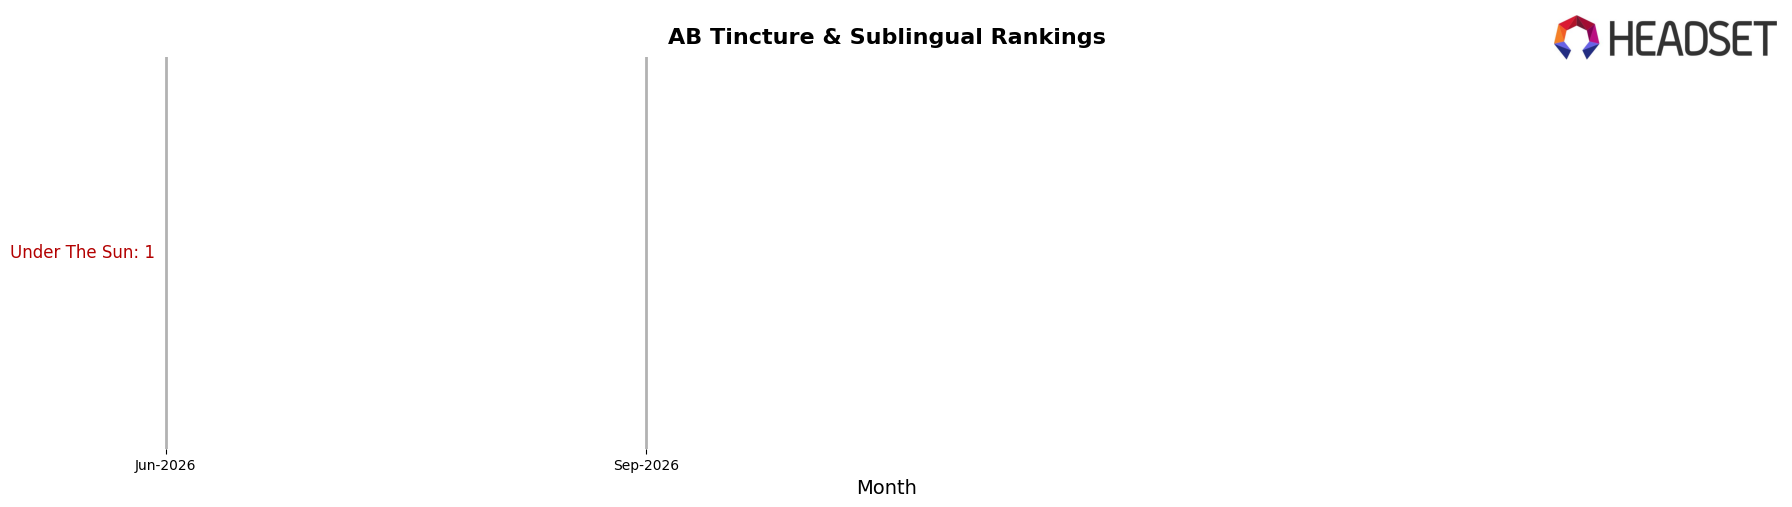
Under The Sun holds rank #2 in AB Tincture & Sublingual in September 2026, slipping 1 position year over year from #1, after peaking at #1 in June 2026 and easing from #1 three months ago to #2 now; this shift contrasts with Potluck, which sits at #1 in September 2026 after improving from #2 year over year and posting a 55.1% sales increase, while Kin Slips remains at #3 with a year-over-year rank of #4 and a 56.9% decline in sales. The combination of a 1-rank YoY drop for Under The Sun and a competitor gaining 1 rank with double-digit growth implies the brand is ceding momentum at the top of the ladder and must defend share against a rising leader.
Notable Products
CBD Pure Tincture (5000mg CBD, 30ml) rose +34.6% month over month to rank 1 in September 2026, but there was no offsetting surge above +50% nor any top-tier decline below -10%, indicating a concentrated advance at the category leader rather than a broad reshuffle. With rank 1 secured while the brand’s only other listed SKU, CBD 5000 Only Pure Oil (30ml), carried no reported rank and no month-over-month figure, the mix skews toward a single hero item rather than a balanced ladder. Tincture & Sublingual effectively anchors the top position while Oil contributes no ranked presence, which implies a reliance on one high-dosage format rather than diversified traction across adjacent formats. This pattern suggests Under The Sun is consolidating around a flagship potency play, pointing commercial focus toward deepening the lead SKU rather than expanding breadth in September 2026.
Top Selling Cannabis Brands






Data for this report comes from real-time sales reporting by participating cannabis retailers via their point-of-sale systems, which are linked up with Headset’s business intelligence software. Headset’s data is very reliable, as it comes digitally direct from our partner retailers. However, the potential does exist for misreporting in the instance of duplicates, incorrectly classified products, inaccurate entry of products into point-of-sale systems, or even simple human error at the point of purchase. Thus, there is a slight margin of error to consider. Brands listed on this page are ranked in the top twenty within the market and product category by total retail sales volume.

