Jun-2026
Sales
Trend
6-Month
Product Count
SKUs
Avg Price
YoY Sales Change
YoY Price Change
Market Insights Snapshot
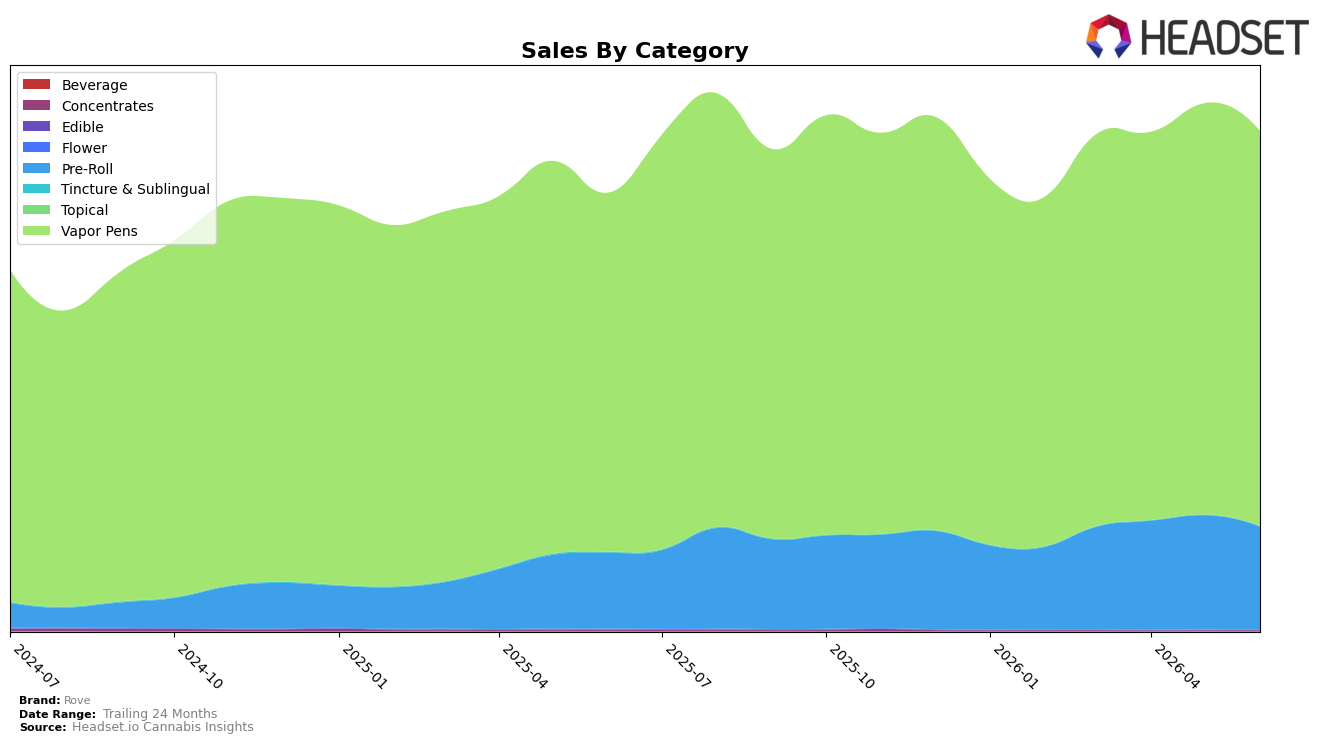
Rove’s June 2026 mix is concentrated in Vapor Pens at 79.30% share with 10.00% YoY growth but a 3.99% MoM decline, while Pre-Roll holds 20.58% share with 36.01% YoY growth and a 9.99% MoM decline; minor lines include Concentrates at 0.07% share with a 38.29% YoY drop and 2.68% MoM decline, and Beverage at 0.03% share with 10.54% YoY growth and a 29.43% MoM jump. Despite a 14.18% YoY lift in total brand sales and an average price down 4.30% YoY to $38.64, category-level MoM softness in the two largest segments offsets micro-category volatility (Flower up 78.31% MoM off a 0.00% share base and down 96.66% YoY), implying June was a pause in mix-led expansion rather than a structural pivot.
The pattern suggests Rove is anchored to its top category while testing edge extensions: the 79.30% Vapor Pens weight, paired with a number 1 rank in Vapor Pens in Nevada, indicates competitive defensibility even as MoM momentum cooled 3.99%, and Pre-Roll’s 36.01% YoY growth at 20.58% share positions it as the secondary growth engine despite a 9.99% MoM pullback. The combination of a 4.30% YoY price reduction and double-digit YoY growth in both core categories implies a volume-led positioning that prioritizes share capture over premiumization, with Beverage’s 29.43% MoM spike and Tincture & Sublingual’s 87.77% YoY contraction signaling selective bets and pruning rather than a broad diversification push.
Competitive Landscape
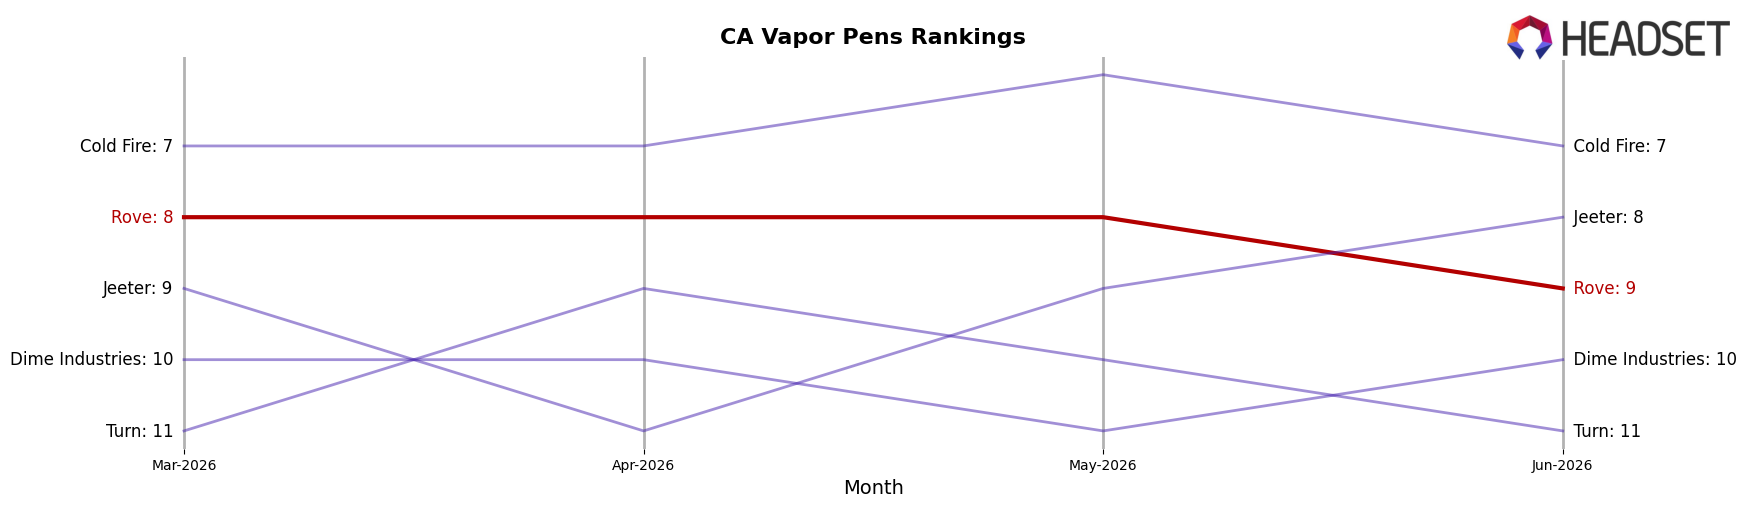
Rove sits at rank #9 in California Vapor Pens in June 2026, improving 1 place year over year from #10 while slipping 1 place from its March 2026 position of #8; that dip follows a brief peak at #8 in May 2026, indicating a short-term pullback after a quarterly uptick. Competitive movement is mixed: Jetty Extracts advanced from #5 to #3 with a 47.3% year-over-year sales increase, while Plug Play edged down from #3 to #4 on a 7.0% decline, and category leader STIIIZY held #1 with a 7.0% year-over-year contraction; against that backdrop, Rove’s modest rank gain of one position year over year alongside a one-position quarter-over-quarter retreat implies stabilization rather than breakout momentum in the near term.
Notable Products
Waui Liquid Diamond Live Resin Disposable Pod (1g) posts the steepest movement in June 2026 with a -9.8% month-over-month decline while holding rank 2, outpacing the softer -3.7% dip for Blue Dream Live Resin Liquid Diamond Disposable (1g) at rank 1. Blue Dream retains the top spot despite the contraction, and Pineapple Express Live Resin Melted Diamond Disposable (1g) rises 5.7% MoM to rank 6, indicating mix resilience toward certain disposable formats even as flagship items contract. Nine of the top ten are Vapor Pens products, with at least four Liquid/Melted Diamond variants in the top six and a single-month revenue peak of $646,660 at rank 1, which points to format-led concentration where disposables and diamond-positioned SKUs act as the volume anchor while cartridges and reload pods take a secondary role. The pattern implies Rove’s commercial direction is consolidating around high-throughput disposable diamond SKUs, prioritizing format stickiness over adding breadth across categories.
Top Selling Cannabis Brands
Data for this report comes from real-time sales reporting by participating cannabis retailers via their point-of-sale systems, which are linked up with Headset’s business intelligence software. Headset’s data is very reliable, as it comes digitally direct from our partner retailers. However, the potential does exist for misreporting in the instance of duplicates, incorrectly classified products, inaccurate entry of products into point-of-sale systems, or even simple human error at the point of purchase. Thus, there is a slight margin of error to consider. Brands listed on this page are ranked in the top twenty within the market and product category by total retail sales volume.

