Market Insights Snapshot
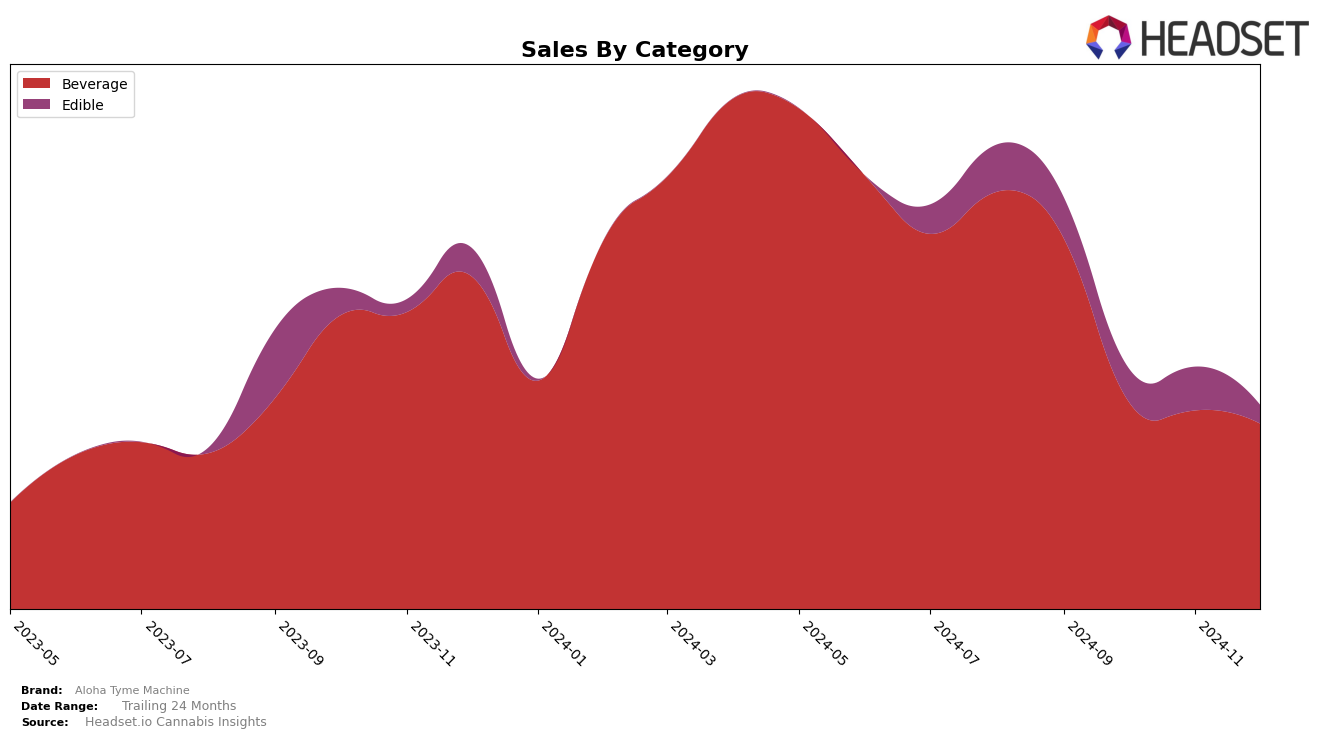
Aloha Tyme Machine has shown a noteworthy presence in the Arizona cannabis beverage market. In September 2024, the brand achieved an impressive 8th place ranking, indicating strong consumer interest and market penetration within this category. However, the absence of rankings for October, November, and December suggests that the brand did not maintain its position in the top 30 for subsequent months. This decline could be attributed to increased competition or seasonal variations in consumer preferences, highlighting potential areas for strategic improvements.
Despite the drop in rankings post-September, Aloha Tyme Machine’s initial success in Arizona can be seen as a positive indicator of its potential appeal in other markets or categories. The brand might benefit from exploring different product innovations or marketing strategies to regain its standing. The initial sales figure in September reflects a promising start, suggesting that with the right adjustments, Aloha Tyme Machine could reclaim its position and potentially expand its influence beyond the beverage category. Further analysis into consumer behavior and competitor strategies in Arizona could provide valuable insights for the brand's future growth.
Competitive Landscape
In the competitive landscape of the beverage category in Arizona, Aloha Tyme Machine experienced a notable shift in its market presence from September to December 2024. Initially ranked 8th in September, Aloha Tyme Machine did not maintain a position in the top 20 for the subsequent months, indicating a potential decline in market visibility or sales performance. In contrast, Pure & Simple showed a more consistent performance, maintaining a top 10 rank throughout the same period, with a peak at 7th place in October. This stability suggests that Pure & Simple may have captured a larger share of consumer interest or loyalty. Meanwhile, CQ (Cannabis Quencher) emerged in December, securing the 10th position, which could indicate a growing competitive threat or a shift in consumer preferences towards their offerings. These dynamics highlight the importance for Aloha Tyme Machine to reassess its strategies to regain and sustain its competitive edge in the Arizona beverage market.

Notable Products
In December 2024, Blackberry Lemonade RSO Juice (100mg THC, 12.5oz) retained its top position in sales for Aloha Tyme Machine, maintaining its number one rank from November, with sales of 123 units. Strawberry Lemonade (100mg) climbed to the second rank, showing a slight decline in sales from October. Tropical Fruit Punch x RSO Drink (100mg) remained consistent at the third position, marking a steady performance since its debut in November. Arnie Half & Half Tea Lemonade (100mg THC, 8oz) held the fourth rank, improving from its fifth position in October. Peach Bellini Juice (100mg) dropped to the fifth rank, showing a significant decline in sales compared to September and October.
Top Selling Cannabis Brands
Data for this report comes from real-time sales reporting by participating cannabis retailers via their point-of-sale systems, which are linked up with Headset’s business intelligence software. Headset’s data is very reliable, as it comes digitally direct from our partner retailers. However, the potential does exist for misreporting in the instance of duplicates, incorrectly classified products, inaccurate entry of products into point-of-sale systems, or even simple human error at the point of purchase. Thus, there is a slight margin of error to consider. Brands listed on this page are ranked in the top twenty within the market and product category by total retail sales volume.

