Jun-2026
Sales
Trend
6-Month
Product Count
SKUs
Avg Price
YoY Sales Change
YoY Price Change
Market Insights Snapshot
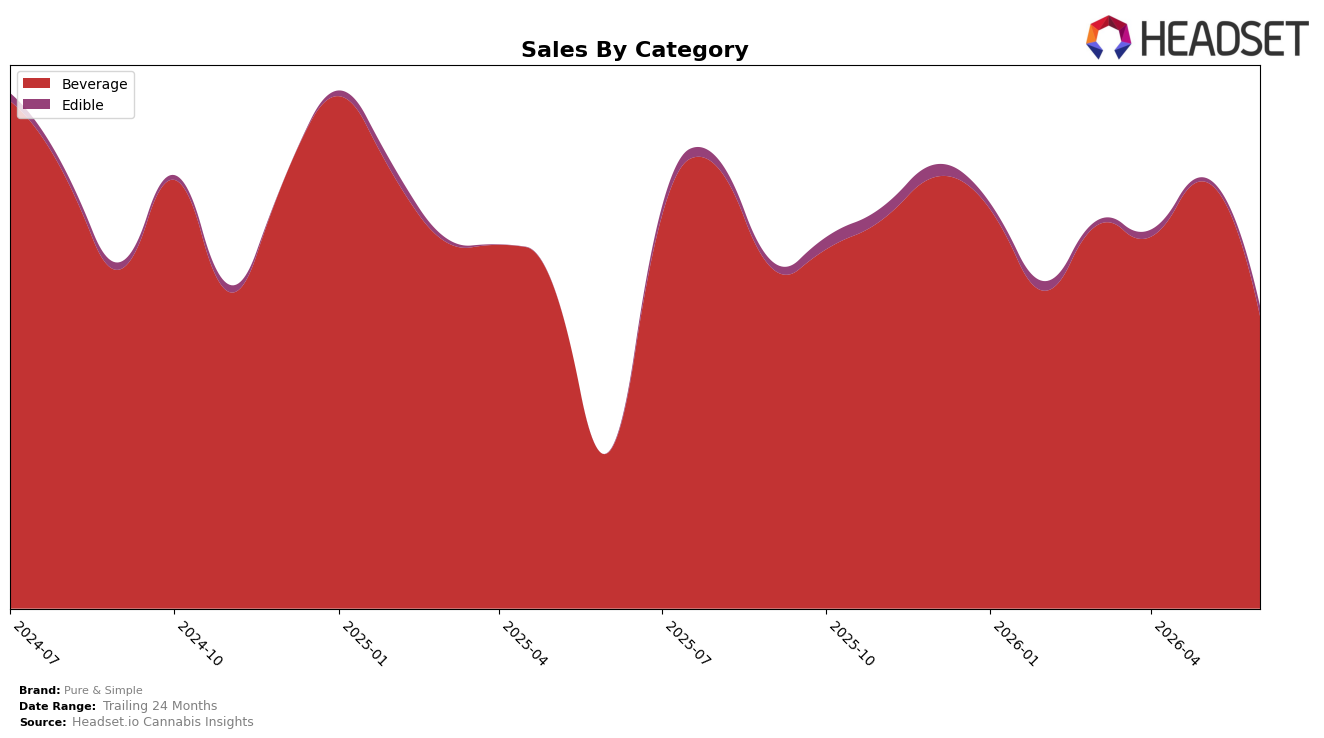
Pure & Simple concentrated 96.81% of June 2026 sales in Beverage, with Edible at 3.19%, while total brand sales rose 94.06% year over year even as average price fell 3.56%. Within the mix, Beverage grew 87.87% YoY but declined 31.50% month over month, whereas Edible expanded 168.36% MoM off a small base and had no reported YoY. With Beverage ranked 8 in Arizona Beverage in June 2026 and the brand’s average price at $13.09, the pattern implies a Beverage-led scale that is vulnerable to intra-quarter volatility, while Edible is functioning as a nascent hedge that can absorb some month-level softness as share edges above 3%.
The split between a 31.50% MoM contraction in Beverage and a 168.36% MoM surge in Edible suggests Pure & Simple is shifting from a single-pillar category exposure toward a barbell, where a small but faster-moving Edible line counterbalances Beverage swings without disrupting a 96.81% anchor. Coupled with an 87.87% YoY gain in Beverage and a 3.56% price contraction, the mix points to a volume-led strategy aimed at rank stability at 8 in Arizona Beverage, implying the path to insulation is incremental Edible penetration while maintaining Beverage throughput to protect share.
Competitive Landscape
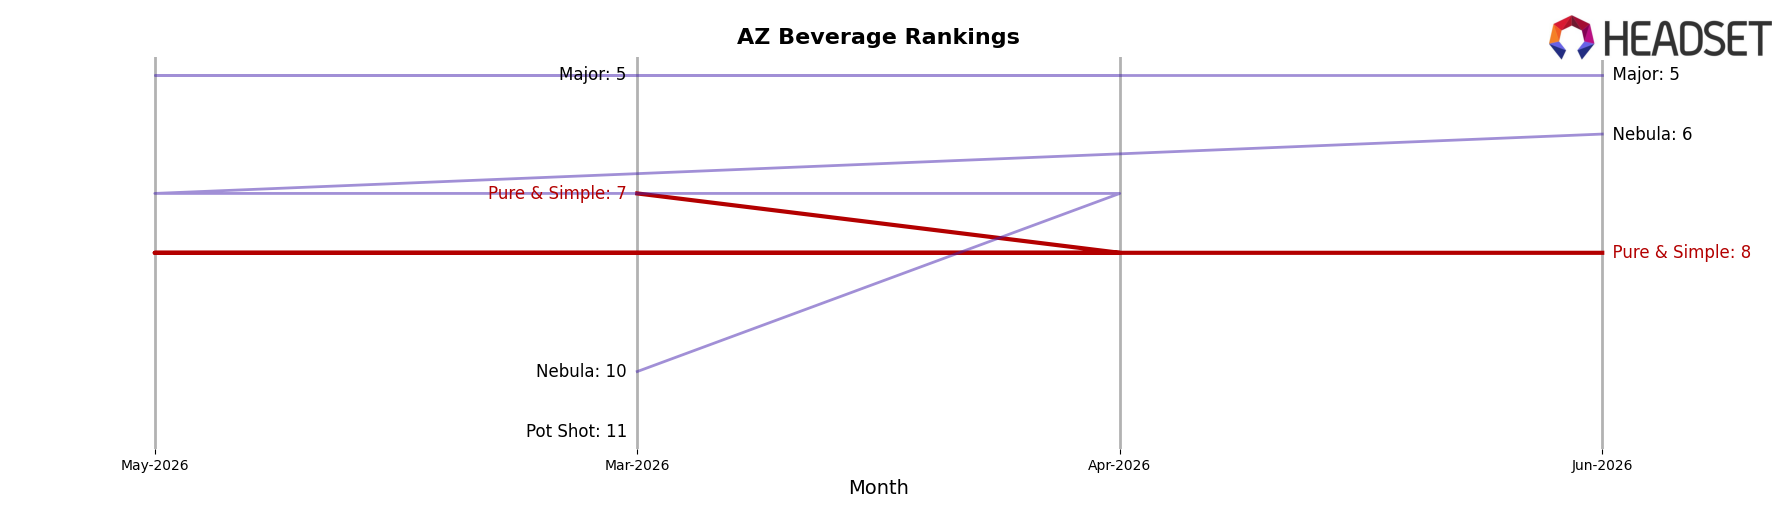
Pure & Simple sits at #8 in AZ Beverage in June 2026, improving 3 positions from #11 year over year but slipping 1 spot from #7 in March 2026 to #8 by June 2026; that #7 in March 2026 also marks its peak rank, and the brand is down 1 place versus #7 three months ago. In contrast, Uncle Arnie's climbed from #5 to #3 alongside a 391.8% year-over-year sales increase while Sip Elixirs held #2 with a 3.4% year-over-year sales decline, and Keef Cola maintained #1 with a 7.7% year-over-year sales gain. The pattern implies Pure & Simple’s rank trajectory is stabilizing in the upper tier but ceding momentum to faster risers, making sustained mid-single-digit rank gains less likely without a driver that reverses the March-to-June slippage.
Notable Products
Apple Fruit Chews 10-Pack (100mg) posted the largest month-over-month move with +168.9% in June 2026, jumping into rank 5 while Beverage leaders slid, as Prickly Pear Lemonade (100mg THC, 8oz) fell -12.9% at rank 1 and Orange Juice (100mg THC, 8oz) declined -26.2% at rank 2. Within the top ten, four of the top five are Beverage SKUs, yet three of those beverages show double‑digit drops between -12.9% and -49.9% and Hibiscus Citrus Juice (100mg THC, 8oz) sits at rank 4 after a -35.6% decline, indicating the category’s hold on share is being tested by fast‑rising Edibles. The mix suggests Pure & Simple is pivoting from a beverage-first lineup toward a more diversified portfolio where Edibles can absorb volatility and capture incremental demand, even if near-term dollar volume still concentrates around $3.9k at the top SKU.
Top Selling Cannabis Brands
Data for this report comes from real-time sales reporting by participating cannabis retailers via their point-of-sale systems, which are linked up with Headset’s business intelligence software. Headset’s data is very reliable, as it comes digitally direct from our partner retailers. However, the potential does exist for misreporting in the instance of duplicates, incorrectly classified products, inaccurate entry of products into point-of-sale systems, or even simple human error at the point of purchase. Thus, there is a slight margin of error to consider. Brands listed on this page are ranked in the top twenty within the market and product category by total retail sales volume.

