Jun-2026
Sales
Trend
6-Month
Product Count
SKUs
Avg Price
YoY Sales Change
YoY Price Change
Market Insights Snapshot
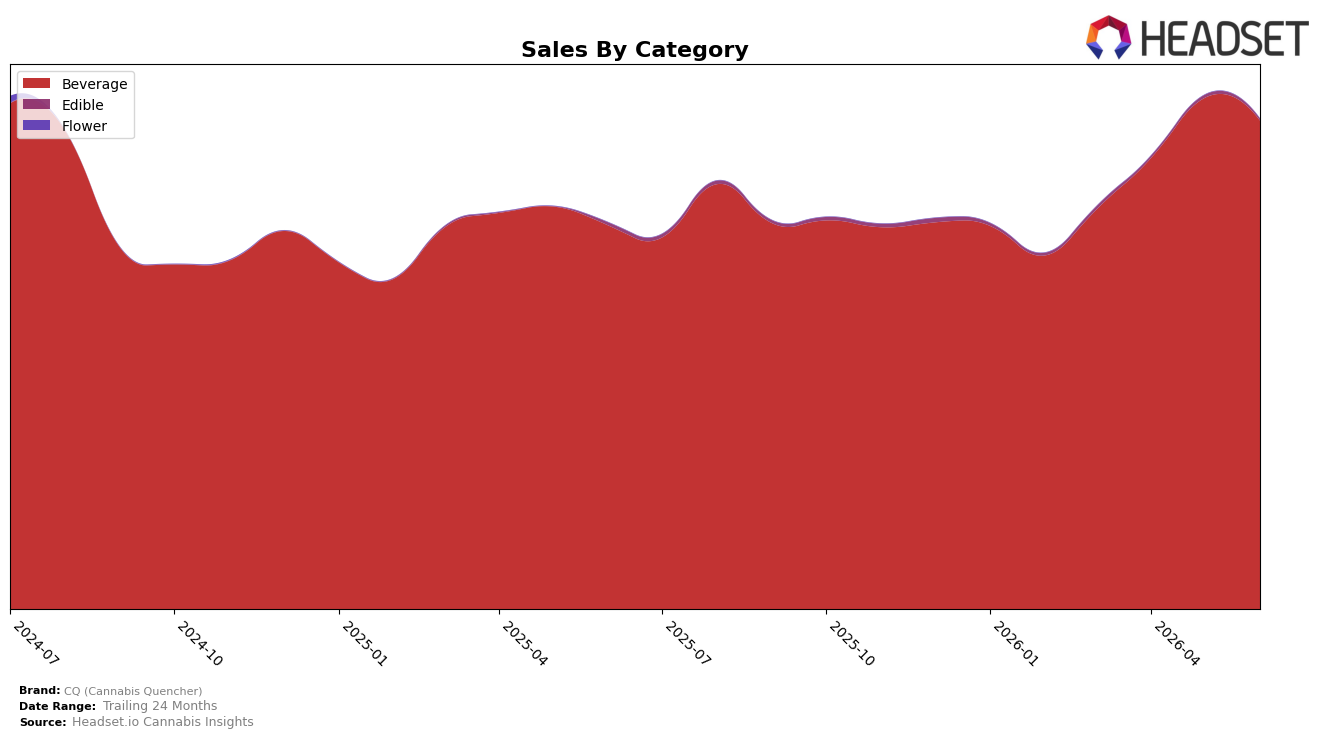
In June 2026, CQ (Cannabis Quencher) derived 99.68% category share from Beverage with year-over-year growth of 27.35% but a month-over-month decline of 4.45%, while Edible held 0.32% share with a 38.43% YoY drop and a 39.39% MoM decline. Average price rose 7.64% YoY to $8.69, with Beverage pricing at $8.68 versus Edible at $13.16, implying mix shift defenses as Beverage volume absorbs most demand. The pattern implies CQ (Cannabis Quencher) is consolidating around Beverage growth while intentionally or passively exiting low-scale Edible volume, prioritizing price-supported Beverage throughput despite near-term MoM softness.
CQ (Cannabis Quencher) holds rank 3 in Beverage in Michigan, and the 27.35% YoY Beverage growth versus a 4.45% MoM pullback signals momentum that is seasonal or promo-sensitive rather than structurally reversing, especially as brand-level sales grew 26.91% YoY. With Beverage at 99.68% mix and Edible shrinking 38.43% YoY, the near-total reliance on a single category suggests a positioning anchored in value-density at an $8.69 average price while ceding premium-priced Edible niches; the thesis is that CQ (Cannabis Quencher) is trading breadth for depth, aiming to defend a top-3 slot through focused Beverage scale rather than multi-category expansion.
Competitive Landscape
CQ (Cannabis Quencher) is ranked #3 in MI Beverage in June 2026, rising 4 positions year over year from #7, and edging up 1 position since March 2026 from #4; this matches a new peak rank of #3 in June 2026 while holding a top-5 position for two consecutive quarterly markers. Against competitors, Mary Jones climbed from #2 to #1 with 22.2% year-over-year sales growth, while Keef Cola slipped from #1 to #2 amid a 10.5% decline, indicating CQ’s upward move is happening as the former leader softens and the current leader expands. This trajectory implies CQ is positioned to challenge for #2 as churn at the top reshuffles share, provided it converts its rank momentum from #4 in March 2026 to #3 in June 2026 into sustained gains against both an expanding #1 and a contracting #2.

Notable Products
Watermelon Lemonade Live Resin Shot (100mg THC, 2oz) posted the steepest decline at -29.95% and slid to rank 7, while Strawberry Lemonade Shot (100mg THC, 2.2oz) fell -22.59% at rank 5; in contrast, Ginger Ale Soda (100mg THC, 355ml, 12oz) rose +1.92% to hold rank 1 with $68,077, signaling share consolidates at the very top even as mid-pack shots retrench. Dr. Quencher Soda (100mg THC, 12oz) dropped -11.47% at rank 2 and Caffeinated Classic Cola Soda (100mg THC, 12oz) declined -14.50% at rank 3, yet three of the top three positions remain sodas while five of the top ten are shots, indicating the portfolio leans on carbonated leaders while concentrated formats absorb volatility; the pattern implies CQ (Cannabis Quencher) is drifting toward a soda-led mix with selective pruning or repositioning needed in shots.
Top Selling Cannabis Brands
Data for this report comes from real-time sales reporting by participating cannabis retailers via their point-of-sale systems, which are linked up with Headset’s business intelligence software. Headset’s data is very reliable, as it comes digitally direct from our partner retailers. However, the potential does exist for misreporting in the instance of duplicates, incorrectly classified products, inaccurate entry of products into point-of-sale systems, or even simple human error at the point of purchase. Thus, there is a slight margin of error to consider. Brands listed on this page are ranked in the top twenty within the market and product category by total retail sales volume.

