.svg)

Sep-2026
Sales
Trend
6-Month
Product Count
SKUs
Avg Price
YoY Sales Change
YoY Price Change


Where to Buy
Artet is stocked at 27 licensed dispensaries across Illinois and California, 26 of them in Illinois, with the deepest coverage in Addison, Chicago, Benton, Bourbonnais, and Danville. Search by ZIP code or city below to find the closest one, or filter by product type if you are after a specific format.
Market Insights Snapshot
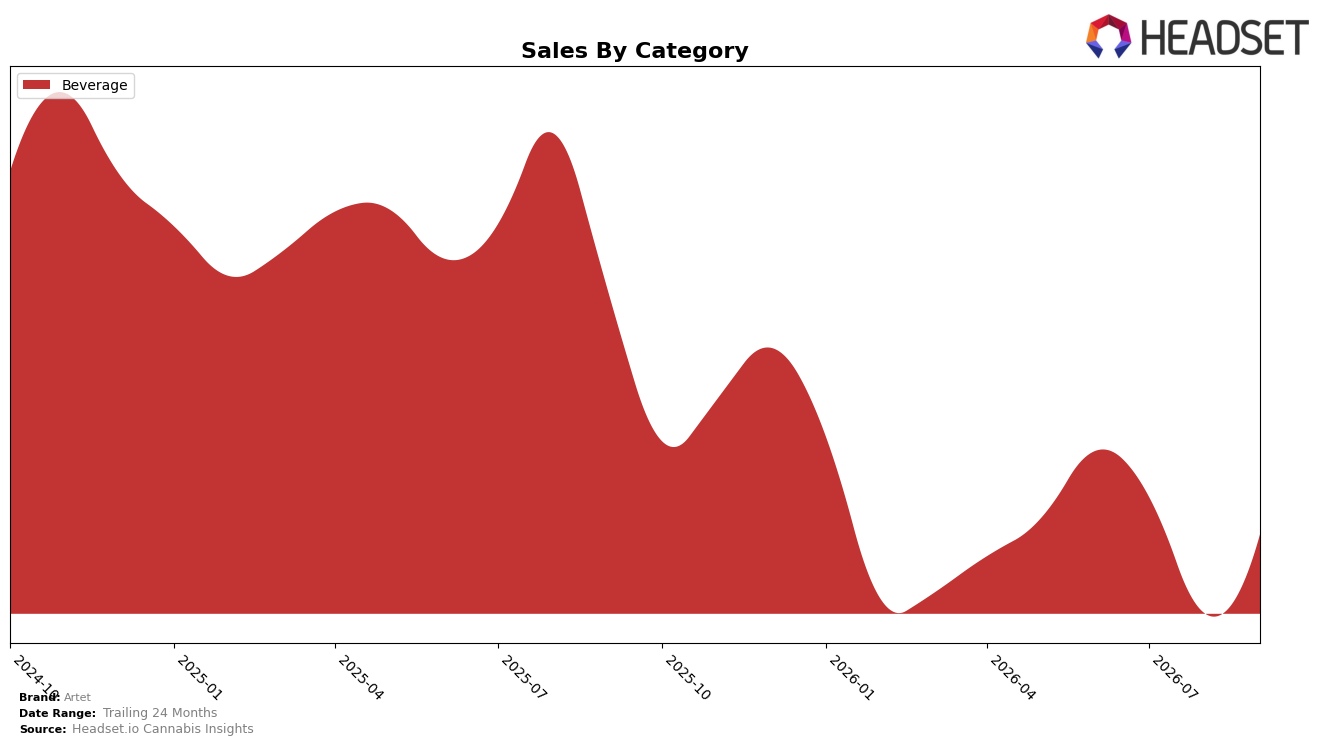
Artet operated as a single-category brand in September 2026, with Beverage at 100.0% of mix and a month-over-month lift of 80.15% alongside a year-over-year decline of 57.75%. Average price contracted 1.60% year over year to $22.84 while Beverage share remained at 100.0%, indicating that the 68.96% two-year sales contraction concentrated fully within Beverage. The pattern implies demand volatility concentrated in one lane: a sharp monthly rebound within Beverage coexisting with a steep annual pullback suggests short-cycle responsiveness without diversification to buffer longer-cycle attrition.
Positioning now hinges on how a Beverage-only footprint translates at the shelf, where Illinois Beverage rank sits at 12 and the brand’s full exposure sits in one category with 100.0% share of mix. With price down 1.60% YoY against a 57.75% annual sales decline and an 80.15% monthly upswing, the elasticity signal skews more toward volume swings than price resets, implying that merchandising cadence and distribution intensity likely outweigh ticket size in near-term outcomes. The implication is that sustaining rank 12 in Beverage requires reinforcing repeat and availability levers within that category rather than pursuing further price movement, because the variance profile indicates activation-driven peaks amid a structurally smaller annual base.
Competitive Landscape
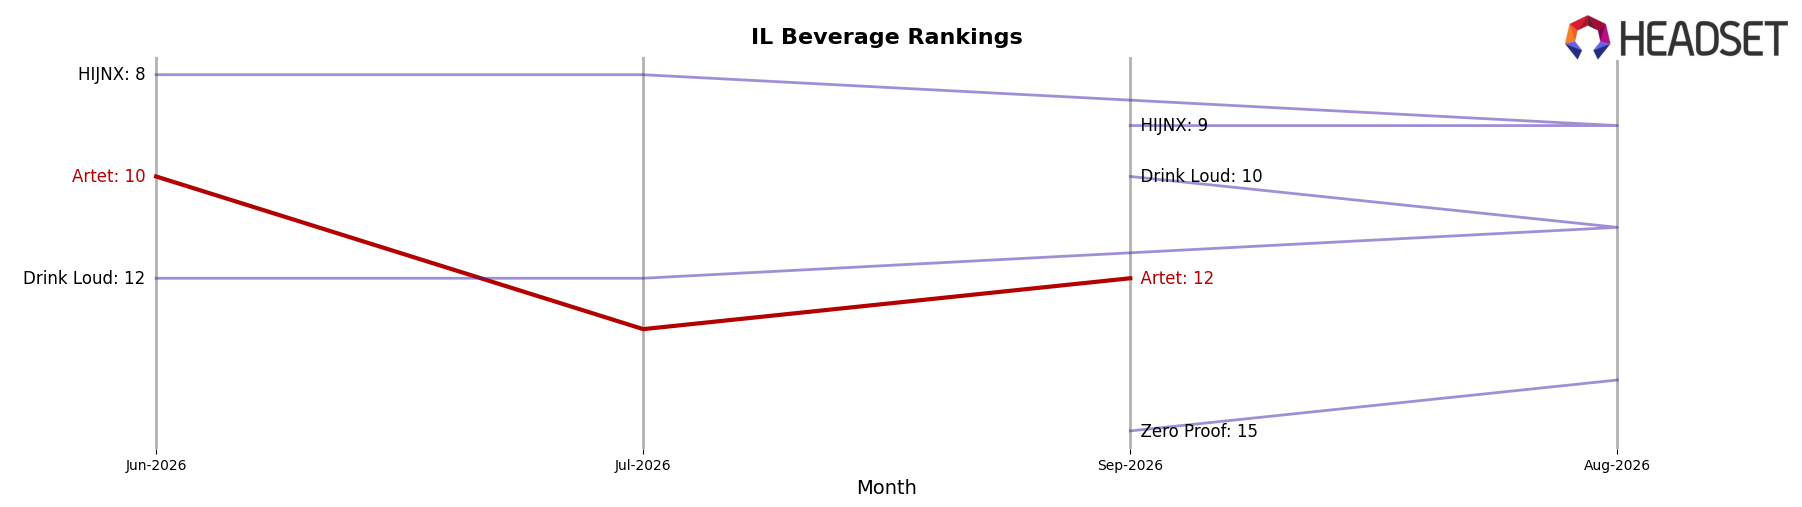
Artet sits at rank #12 in IL Beverage in September 2026, unchanged from #12 year over year, after sliding from #10 three months ago and below its #8 peak in February 2025; in contrast, Uncle Arnie's held #1 both this year and last despite a -13.7% YoY sales change, while Journeyman maintained #2 with +10.7% YoY growth and Daze Off stayed at #3 with +22.1% YoY growth. Against peers with negative YoY shifts like CQ (Cannabis Quencher) at -13.0% and tonic at -11.3%, Artet’s flat YoY rank at #12 alongside a quarter-on-quarter drop from #10 indicates share stabilization year over year but incremental erosion in recent months, implying the brand is being outpaced at the margin by faster-growing mid-tier competitors.
Notable Products
Founders Reserve - Aperitif Live Resin Infused Drink (100mg THC, 750ml) posted the largest month-over-month gain at 134.99% and climbed into rank 3, indicating a sharp shift toward higher-potency aperitifs. CBD/THC 1:1 Strawberry Basil Spritz Sparkling Drink 4-Pack (100mg CBD, 100mg THC, 8oz, 237ml) rose 123.99% to rank 1 while CBD/THC 1:1 Mango Ginger Spritz Sparking Drink 4-Pack (100mg CBD, 100mg THC,12oz) increased 122.88% to rank 2, and four of the top five SKUs are Beverage formats, concentrating demand in ready-to-drink and aperitif segments. By contrast, Cannabis Apertif Elixir (100mg THC, 750ml) declined 7.62% and slid to rank 4 even as peers expanded, with Founders Reserve now outselling the legacy Elixir despite the Elixir’s $2,062 September sales. The pattern implies consumers are tilting toward premium, higher-THC and flavor-forward beverages, suggesting Artet’s mix is migrating from classic elixirs toward multipack spritzes and modern aperitifs that scale faster month over month.
Top Selling Cannabis Brands






Data for this report comes from real-time sales reporting by participating cannabis retailers via their point-of-sale systems, which are linked up with Headset’s business intelligence software. Headset’s data is very reliable, as it comes digitally direct from our partner retailers. However, the potential does exist for misreporting in the instance of duplicates, incorrectly classified products, inaccurate entry of products into point-of-sale systems, or even simple human error at the point of purchase. Thus, there is a slight margin of error to consider. Brands listed on this page are ranked in the top twenty within the market and product category by total retail sales volume.

