.svg)

Sep-2026
Sales
Trend
6-Month
Product Count
SKUs
Avg Price
YoY Sales Change
YoY Price Change



Where to Buy
CANN Social Tonics is stocked at 208 licensed dispensaries across California, Connecticut, and 2 other states, 190 of them in California, with the deepest coverage in Los Angeles, San Diego, San Francisco, Santa Rosa, and Costa Mesa. Search by ZIP code or city below to find the closest one, or filter by product type if you are after a specific format.
Market Insights Snapshot
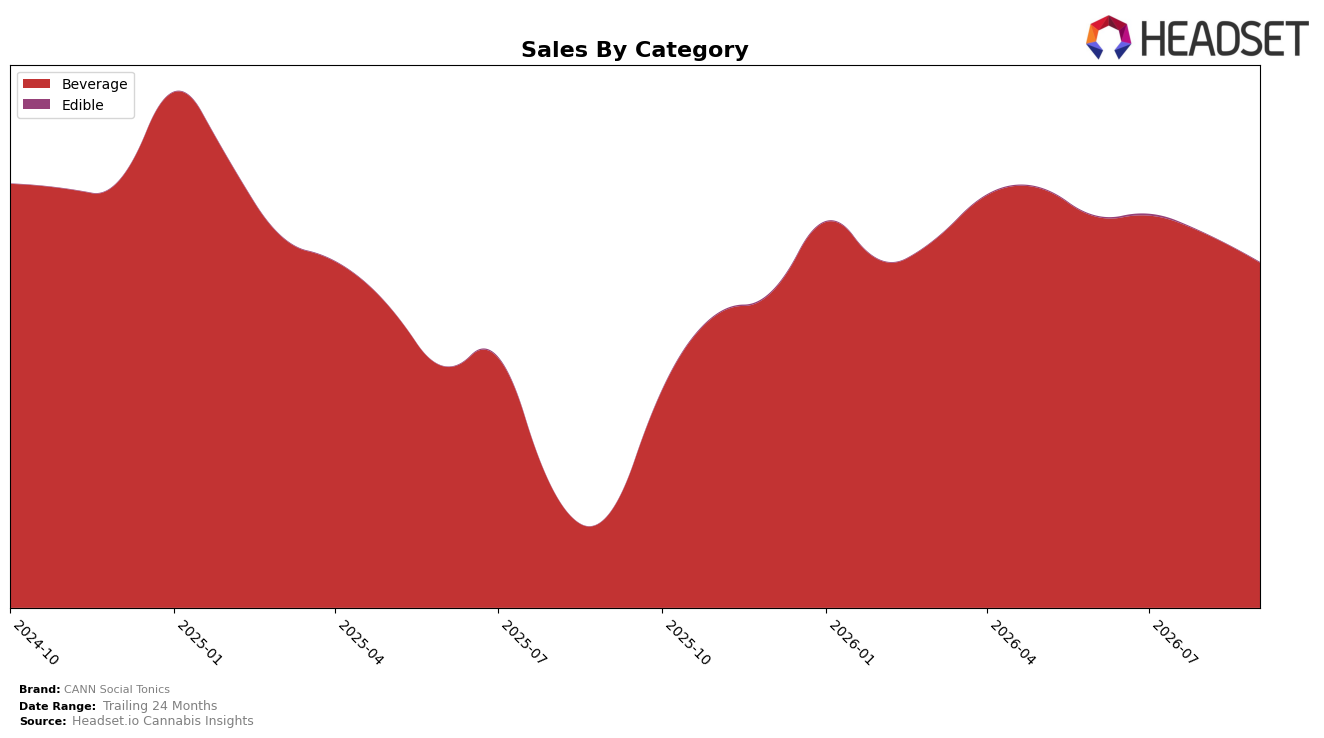
Beverage contributed 99.87% share in September 2026 and held rank 4 in Beverage in Connecticut, while Edible accounted for 0.13% share; the Beverage segment grew 273.32% year over year but declined 7.83% month over month, and Edible surged 63.76% month over month off a minimal base with no year-over-year comp. Average price rose 37.69% year over year to $15.80, with Beverage pricing at $15.80 versus Edible at $23.67, implying premiumization within the core while category breadth remains narrow; the pattern suggests the brand is concentrated in Beverage with seasonal or promotional sensitivity driving the month-over-month dip despite expansive year-over-year gains.
With Beverage at 99.87% share and a rank position of 4 in Connecticut, the 7.83% month-over-month decline alongside a 273.32% year-over-year rise indicates scale-up pressure that can expose volatility when inventory or promotional cadence shifts, whereas the 63.76% month-over-month uptick in Edible at 0.13% share signals experimental adjacency rather than a material hedge. The 37.69% year-over-year price increase paired with near-total Beverage dependence points to a premium positioning that can sustain rank but leaves exposure to price elasticity, implying the next share gains likely come from stabilizing monthly Beverage sell-through while selectively expanding Edible to reduce single-category risk without diluting the premium price narrative.
Competitive Landscape
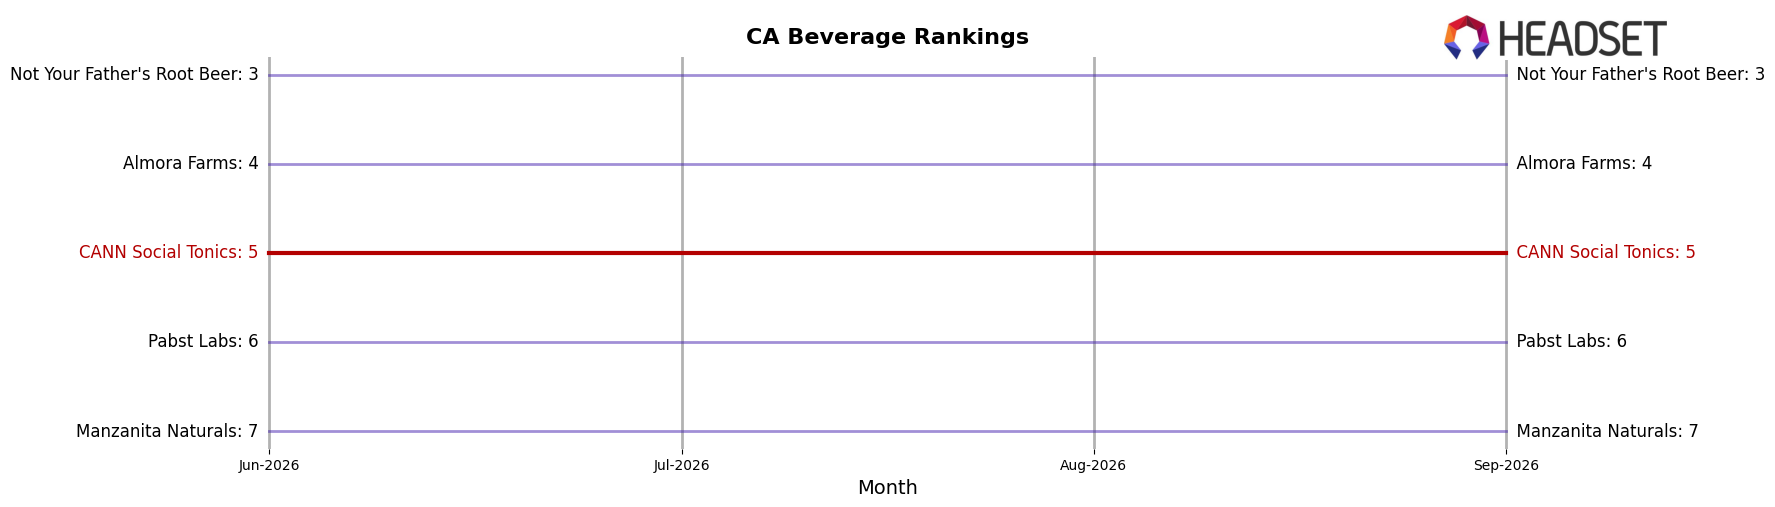
CANN Social Tonics sits at rank #5 in CA Beverage in September 2026, improving 4 positions year over year from #9, while holding flat versus June 2026 at #5; by contrast, Almora Farms advanced to #4 from #6 year over year and St Ides maintained #1 with approximately 15.3% YoY sales growth against a prior #1, indicating CANN’s climb is stabilizing below the top tier. With a prior peak of #3 in March 2025 and a current position of #5 despite Uncle Arnie's holding #2 and Not Your Father's Root Beer fixed at #3 alongside 34.5% YoY sales growth, the pattern implies CANN Social Tonics is consolidating mid‑top placement and will need share capture from ranks #2–#4 to re-test its historical peak.
Notable Products
CBD/THC 2:1 Blood Orange Cardamom Social Tonic 6-Pack (24mg CBD, 12mg THC, 7.5oz, 222ml) posted the largest move in September 2026 with a 312.9% MoM surge that vaulted it to rank 2, while CBD/THC 2:1 Lemon Lavender Social Tonic 6-Pack (24mg CBD, 12mg THC, 7.5oz, 222ml) rose 74.9% to rank 1. In contrast, Hi Boys - Lemon Lavender Social Tonic 4-Pack (20mg THC, 12oz, 355ml) fell 14.5% to rank 6 and the Hi Boy - Grapefruit Rosemary Social Tonic 4-Pack (20mg THC, 1420ml, 48oz) slid 19.5% to rank 10. Four of the top ten are CBD/THC 2:1 six-packs, and the two leading six-packs together generated $154,125, implying a pivot toward lower-dose multipacks gaining traction over higher-dose Hi Boy formats.
Top Selling Cannabis Brands






Data for this report comes from real-time sales reporting by participating cannabis retailers via their point-of-sale systems, which are linked up with Headset’s business intelligence software. Headset’s data is very reliable, as it comes digitally direct from our partner retailers. However, the potential does exist for misreporting in the instance of duplicates, incorrectly classified products, inaccurate entry of products into point-of-sale systems, or even simple human error at the point of purchase. Thus, there is a slight margin of error to consider. Brands listed on this page are ranked in the top twenty within the market and product category by total retail sales volume.

