Jun-2026
Sales
Trend
6-Month
Product Count
SKUs
Avg Price
YoY Sales Change
YoY Price Change
Market Insights Snapshot
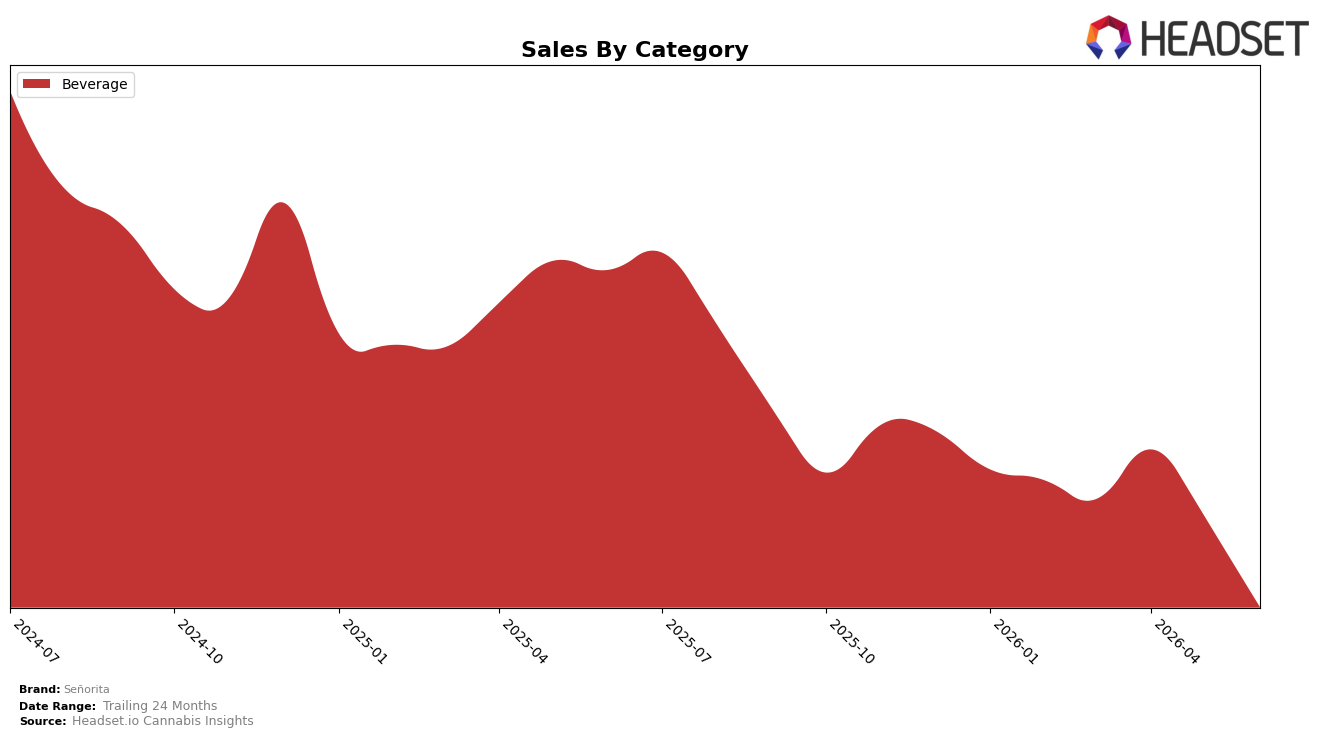
In June 2026, Señorita concentrated entirely in Beverage with a 100.0% category share, while category sales fell 71.9% year over year and 40.8% month over month; average price rose 0.45% YoY alongside a single-category footprint that ranked 21st in Beverage within Ontario. The pattern implies a narrow mix is amplifying volatility, as a 21st rank paired with a 100.0% reliance on Beverage leaves June 2026 performance tethered to a category that contracted sharply both YoY and MoM.
The combination of a 0.45% YoY price lift and a 71.9% sales decline suggests price was not the primary lever, and a 40.8% MoM drop within a fully concentrated mix indicates exposure to demand swings rather than cross-category buffering; holding rank 21 under these contractions points to share preservation at a lower volume base. The implication is that Señorita’s current positioning functions as a volume-light, single-category niche in Beverage, where stabilization would likely require either rebalancing mix away from 100.0% Beverage or deepening penetration within Beverage to convert rank 21 into steadier throughput during months like June 2026 when category momentum is negative.
Competitive Landscape
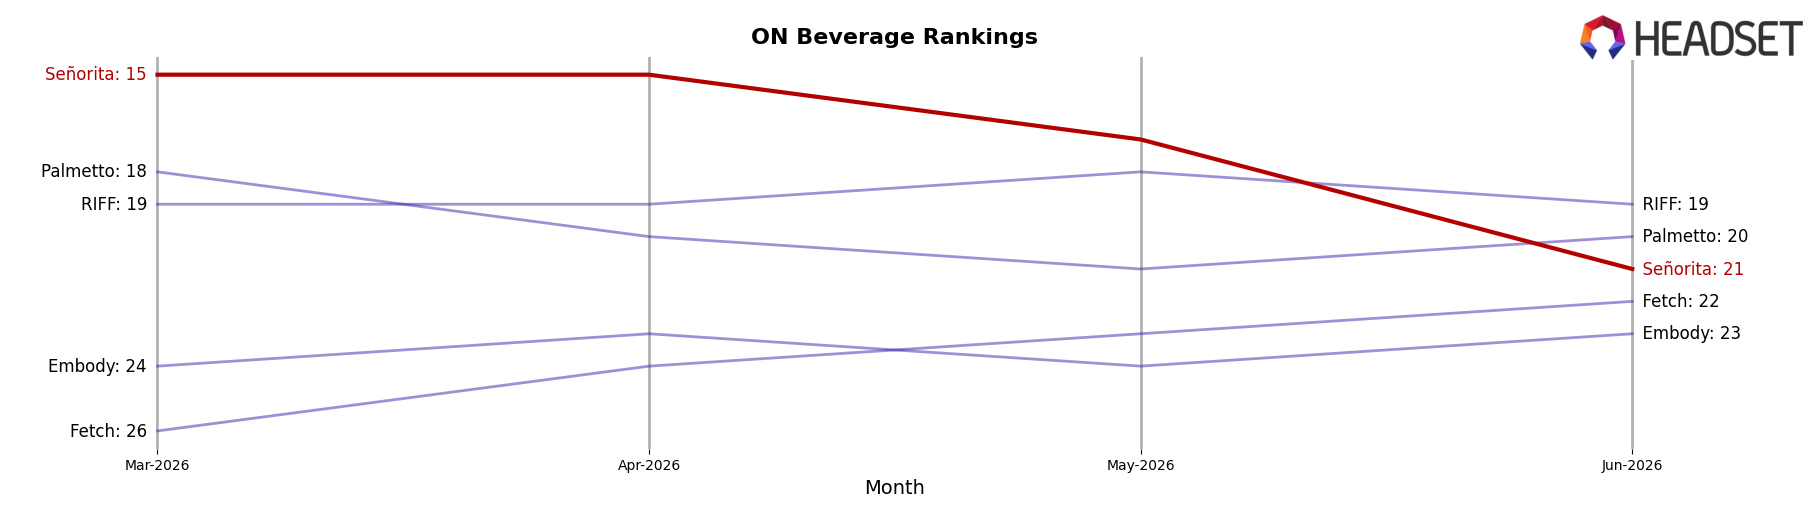
Señorita ranks #21 in ON Beverage in June 2026, down 2 positions year over year from #19 and sliding 6 spots from #15 just three months ago, while its peak of #14 in July 2024 now sits 7 places higher than today; in contrast, TeaPot jumped from #10 to #5 with 129.5% YoY sales growth and Mollo edged up from #4 to #3 despite a 0.9% YoY decline, whereas category leader XMG held #1 year over year but with a 37.0% YoY sales contraction. Given that Señorita’s rank erosion coincides with competitors gaining rank despite mixed or negative sales trends, the pattern implies Señorita is losing relative share momentum and must reverse multi-period rank losses to avoid further displacement.
Notable Products
Mexican Agave, Lime & Jalapeno Margarita Drink (10mg THC, 12oz) led the movement with a -42.8% month-over-month decline while holding rank 1, contrasting with Mexican Agave, Mango Margarita and Lime Drink (10mg THC, 355ml) up 54.7% at rank 3. Mexican Agave, Lime & Ruby Red Grapefruit Margarita Drink (10mg THC, 12oz) fell -12.4% at rank 2, placing two declines in the top two ranks even as one SKU surged from below. With all three top-3 SKUs in Beverage, the category is concentrated at 100% of the top ten cohort for June 2026, and the mix implies a pivot toward Mango momentum while legacy Lime-led variants shed velocity, tilting near-term planning toward flavor innovation over flagship defense.
Top Selling Cannabis Brands
Data for this report comes from real-time sales reporting by participating cannabis retailers via their point-of-sale systems, which are linked up with Headset’s business intelligence software. Headset’s data is very reliable, as it comes digitally direct from our partner retailers. However, the potential does exist for misreporting in the instance of duplicates, incorrectly classified products, inaccurate entry of products into point-of-sale systems, or even simple human error at the point of purchase. Thus, there is a slight margin of error to consider. Brands listed on this page are ranked in the top twenty within the market and product category by total retail sales volume.

