Jun-2026
Sales
Trend
6-Month
Product Count
SKUs
Avg Price
YoY Sales Change
YoY Price Change
Market Insights Snapshot
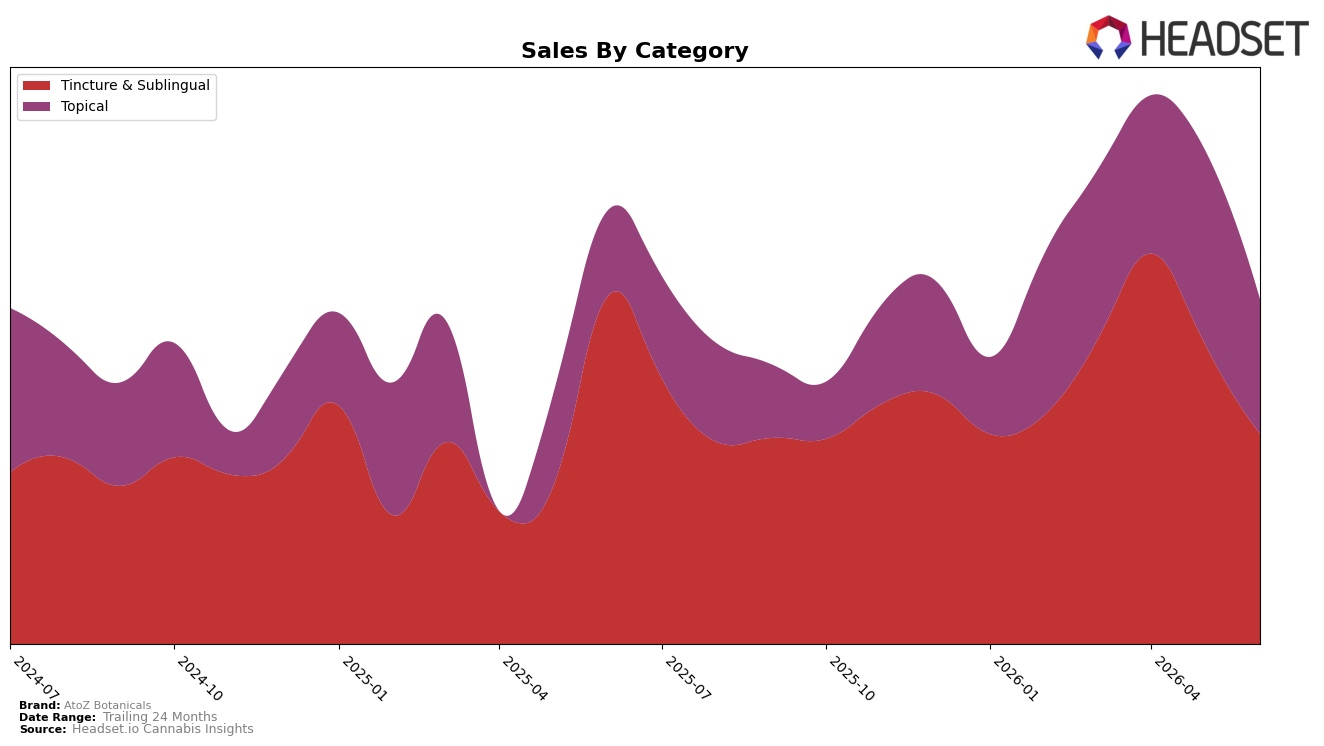
In June 2026, AtoZ Botanicals split nearly evenly across two lines, with Tincture & Sublingual at 58.00% share and Topical at 42.00% share, but the trajectories diverged: Tincture & Sublingual fell 33.37% year over year and 24.70% month over month, while Topical grew 32.32% year over year despite a 22.99% month-over-month pullback. Average prices diverged as well, with Tincture & Sublingual at $33.69 and Topical at $39.70, alongside a brand-wide average price decline of 16.80% year over year. The pattern implies a rebalancing away from Tincture & Sublingual toward Topical, with short-term volume pressure in both categories but a year-over-year growth anchor now centered in Topical.
The mix shift helps explain why brand sales were down 15.81% year over year even as the two-year trend is up 46.10%: the heavier 58.00% exposure to a contracting Tincture & Sublingual base is overruling Topical’s 32.32% year-over-year gain, while simultaneous month-over-month declines of 24.70% in Tincture & Sublingual and 22.99% in Topical compress near-term sell-through. With Arizona as the top state and Tincture & Sublingual as the top category but lacking a current rank in that segment, the positioning implication is that maintaining relevance will require either shifting more mix toward the higher-priced Topical line or rebuilding Tincture & Sublingual velocity, because the present 58.00% weighting toward a declining category amplifies downside in monthly cycles.
Competitive Landscape
AtoZ Botanicals sits at rank #5 in June 2026 in AZ Tincture & Sublingual, down 1 place year over year from #4, and unchanged versus three months ago at #5, while its peak rank of #4 in April 2026 indicates a brief upward touch that was not sustained; in contrast, Drip Oils + Extracts held at #1 year over year with a 17.7% YoY sales increase, and SUNO climbed from #6 to #2 alongside a 365.5% YoY sales surge, whereas Chronic Health slid from #2 to #3 with a 39.1% YoY sales decline; the pattern implies AtoZ Botanicals’ flat-to-slightly-declining rank trajectory is being squeezed by faster risers at the top and weakening mid-tier rivals, signaling a need to choose between defending #5 or reaccelerating toward #4.

Notable Products
CBD Dog Drops Tincture (500mg CBD) led June 2026 with a 106% month-over-month surge and a rank at 1, while Ultra Pain Relief Roll On (1000mg CBD, 1oz) slipped 10% MoM and still sat in the top two by rank 2. Three Tangerine tinctures concentrated within Tincture & Sublingual posted steep pullbacks of 21% and 54% for the 3000mg and 4400mg variants respectively, alongside a 72% decline for the 1400mg Mood Boost, indicating demand pivoting away from higher-potency citrus SKUs toward pet wellness. The coexistence of a triple-digit gainer at rank 1 and two double-digit declines within adjacent formats implies a portfolio tilt toward functional, niche use-cases over premium-strength flavor lines.
Top Selling Cannabis Brands
Data for this report comes from real-time sales reporting by participating cannabis retailers via their point-of-sale systems, which are linked up with Headset’s business intelligence software. Headset’s data is very reliable, as it comes digitally direct from our partner retailers. However, the potential does exist for misreporting in the instance of duplicates, incorrectly classified products, inaccurate entry of products into point-of-sale systems, or even simple human error at the point of purchase. Thus, there is a slight margin of error to consider. Brands listed on this page are ranked in the top twenty within the market and product category by total retail sales volume.

