Jun-2026
Sales
Trend
6-Month
Product Count
SKUs
Avg Price
YoY Sales Change
YoY Price Change
Market Insights Snapshot
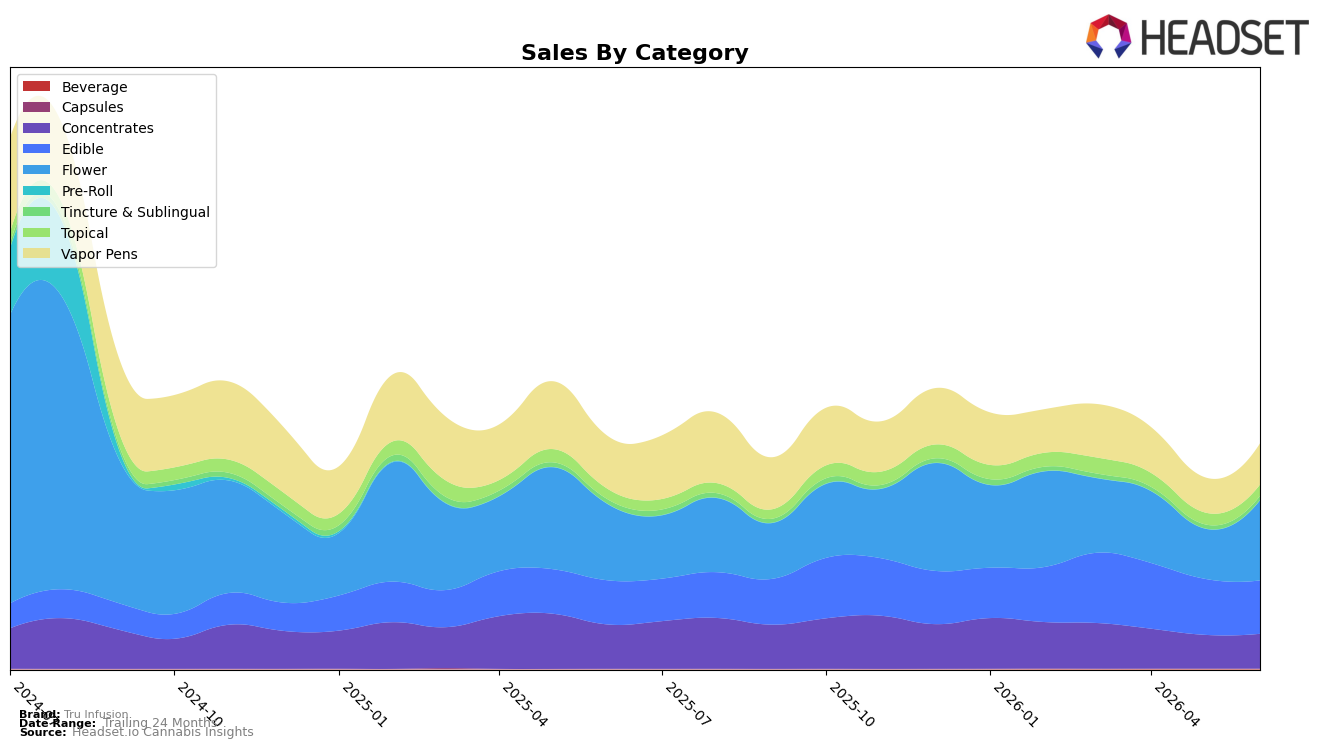
In June 2026, Tru Infusion’s mix tilted toward Flower at 35.67% share with year-over-year growth of 5.48% and a month-over-month surge of 59.84%, while Edible held 23.76% share with 21.17% YoY growth but slipped 4.73% MoM. Vapor Pens accounted for 18.32% share with a 22.17% YoY decline yet gained 17.24% MoM, and Concentrates at 15.46% share fell 21.51% YoY with a modest 3.10% MoM increase; Topical contributed 4.91% share with 8.86% YoY growth but dropped 5.12% MoM. Despite a brand-level YoY sales decline of 3.06% and a 24‑month contraction of 60.27%, the sharp MoM rebound in Flower alongside recovery signs in Vapor Pens implies the month’s volume was pulled by inhalable formats even as Edible steadied overall share.
Average price fell 11.74% YoY to $12.09 while Flower priced at $13.63 and Vapor Pens at $18.38, indicating mix-driven downshifting toward lower price points and promotional elasticity; Edible’s $6.99 average supports that tilt and its 21.17% YoY growth despite a 4.73% MoM dip. With Flower ranked 31 in Arizona and gaining 59.84% MoM, but Vapor Pens and Concentrates still down 22.17% and 21.51% YoY respectively, the pattern implies Tru Infusion is leaning into Flower-led traffic to stabilize demand while premium inhalables lag, positioning the brand around value-accessible inhalables and everyday ingestibles rather than high-ticket formats.
Competitive Landscape
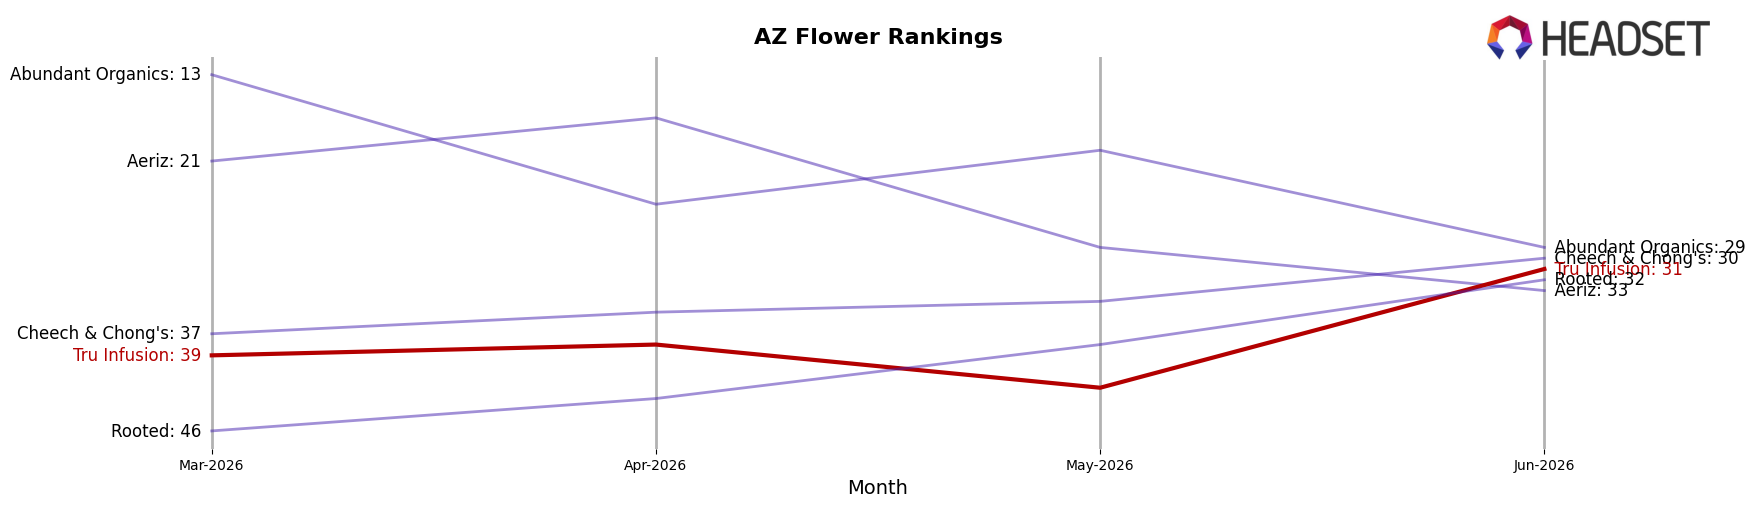
Tru Infusion ranks #31 in AZ Flower in June 2026, improving 5 positions from #36 year over year, and up 8 positions from #39 three months prior, while still sitting 22 places below its peak of #9 from June 2024; in contrast, Just Flower held #1 with a 13.0% YoY sales increase and The Pharm advanced from #5 to #4 with a 44.1% YoY lift. Against faster climbers like Brown Bag, which moved from #7 to #5 on 72.8% YoY growth, Tru Infusion’s modest rank recovery suggests share is stabilizing rather than expanding, implying the brand’s trajectory points to incremental regain of placement but not a return to top-10 competitiveness without sharper velocity gains.
Notable Products
Indica Blueberry Gummies 10-Pack (100mg) posted the steepest movement in June 2026 with a -23.2% month-over-month decline while holding rank 3, and Sativa Strawberry Kiwi Gummies 10-Pack (100mg) also contracted -17.7% at rank 5, indicating demand pressure concentrated in key Edible positions. Sativa Pink Lemonade Gummies 10-Pack (100mg) slid -8.8% at rank 2 as Indica Rainbow Mallow Bites 10-Pack (100mg) fell -13.4% at rank 8, whereas Peach Orange Mango Rosin Gummies 10-Pack (100mg) was the lone Edible gainer at +11.6% in rank 9, implying mix shift within confections rather than category exit. With Mellowz (3.5g) anchoring rank 1 and Hokuzai (3.5g) entering the top ten at rank 10, Flower bookends the leaderboard even as six of the top ten are Edible SKUs, signaling a barbell between flagship Flower and a broad but softening Edible bench. Taken together, the product mix points to Tru Infusion using Flower to secure ranking while reevaluating flavor breadth and rosin emphasis in Edibles to stabilize mid-pack volatility.
Top Selling Cannabis Brands
Data for this report comes from real-time sales reporting by participating cannabis retailers via their point-of-sale systems, which are linked up with Headset’s business intelligence software. Headset’s data is very reliable, as it comes digitally direct from our partner retailers. However, the potential does exist for misreporting in the instance of duplicates, incorrectly classified products, inaccurate entry of products into point-of-sale systems, or even simple human error at the point of purchase. Thus, there is a slight margin of error to consider. Brands listed on this page are ranked in the top twenty within the market and product category by total retail sales volume.

