Jun-2026
Sales
Trend
6-Month
Product Count
SKUs
Avg Price
YoY Sales Change
YoY Price Change
Market Insights Snapshot
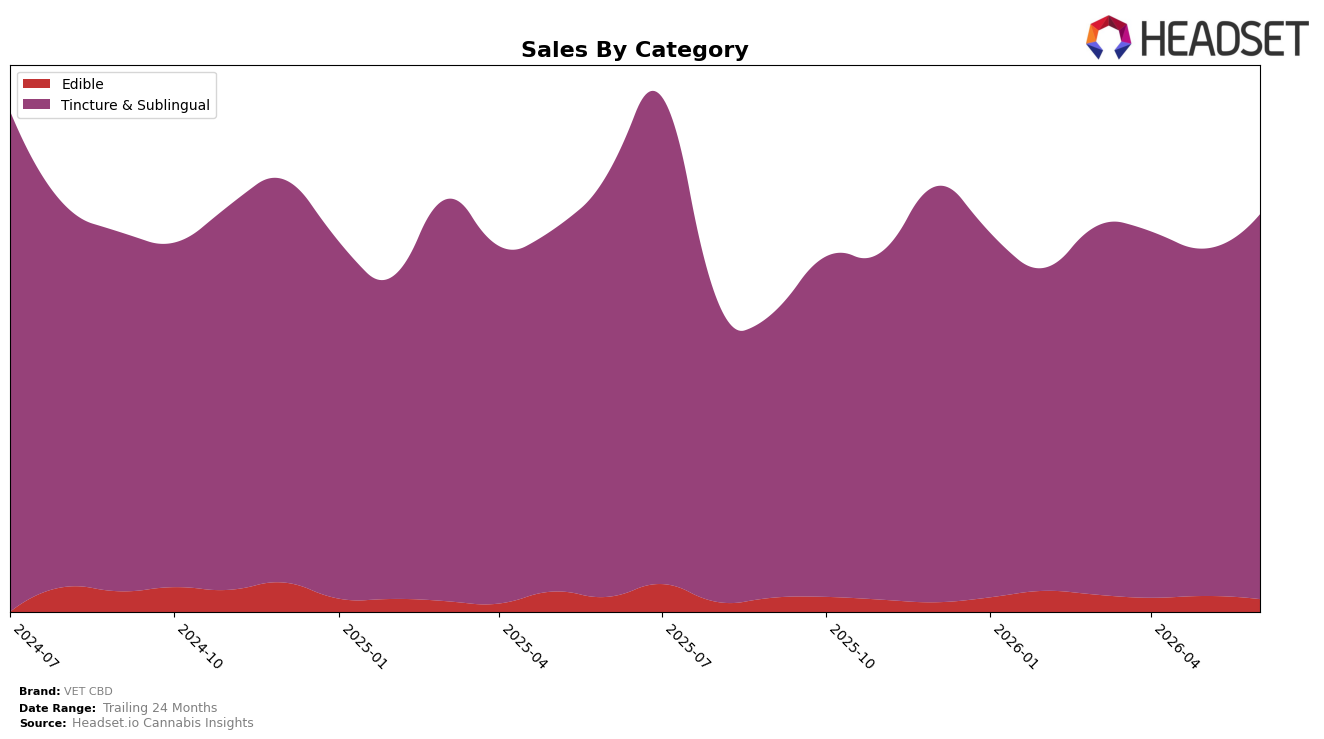
VET CBD remains concentrated in Tincture & Sublingual, holding 96.41% category share with a month-over-month gain of 10.75% even as year-over-year sales in that category fell 9.21%; meanwhile Edible sits at 3.59% share with a 17.93% month-over-month decline and a 14.06% year-over-year decline. Against a brand-level year-over-year sales change of -9.39% and an average price decline of 7.54%, the mix is consolidating toward higher-priced Tincture & Sublingual (average price 46.02) while lower-priced Edible (average price 12.78) contracts. The pattern implies a deliberate tilt toward the core format that is cushioning near-term volume via June 2026 mix gains but limiting diversification that could mitigate category-specific volatility.
With Tincture & Sublingual ranked 4 in California and expanding share inside the brand’s own portfolio by 10.75% month over month while Edible retreats 17.93%, VET CBD is trading breadth for depth in a single category. The combination of a 7.54% price decrease and a 9.39% brand-level year-over-year sales decline suggests the current positioning prioritizes retaining rank in the core over growing secondary formats, implying June 2026 performance is more sensitive to shifts in Tincture & Sublingual demand than to multi-category cross-purchase gains.
Competitive Landscape
VET CBD holds rank #4 in California Tincture & Sublingual for June 2026, unchanged from #4 in June 2025, while Papa & Barkley stayed at #1 as its sales declined 9.7% year over year and ABX / AbsoluteXtracts improved its rank from #7 to #5 alongside a 10.3% sales increase; in contrast, Care By Design remained at #3 despite a 9.6% sales contraction and Yummi Karma held #2 with a 3.3% sales gain. With VET CBD flat at #4 across March 2026 and June 2026 and peers showing both negative and positive shifts, the pattern implies VET CBD is anchored in the second tier: stable positioning that will require either share capture from a weakening #1 or outpacing the rising #5 to change rank trajectory.

Notable Products
CBD/THC 20:1 Regular Strength Tincture (500mg CBD, 25mg THC, 60ml, 2oz) posted the largest month-over-month move in June 2026 at +76.6%, jumping into rank 4 while CBD/THC 20:1 Regular Strength Tincture (1000mg CBD, 50mg THC, 2oz, 60ml) fell -10.8% to rank 6. Meanwhile, CBD/THC 20:1 Regular Strength Tincture (125mg CBD, 6.25mg THC, 1oz, 30ml) rose +13.6% to hold rank 1 as the 250mg Regular Strength variant slipped -3.4% at rank 2, indicating trading down toward mid-size 20:1 formats over higher-dose or premium-price options.
Four of the top ten are Tincture & Sublingual SKUs, with the 10:1 Extra Strength 250mg tincture up +47.3% at rank 9 while the 10:1 Extra Strength 500mg tincture declined -4.6% at rank 5, pointing to renewed interest in lower-volume, therapeutic-dose entries. Edibles softened, as CBD Calming Peanut Butter Soft Chews 30-Pack dropped -29.8% to rank 7 while the 60-Pack gained +13.3% at rank 8 and CBD Mobility Soft Chews 30-Pack inched +12.3% at rank 10, suggesting basket consolidation toward larger counts and away from trial sizes. The pattern implies VET CBD is concentrating demand in mid-strength tinctures and larger-count pet chews, favoring accessible price-per-dose over premium-potency tiers.
Top Selling Cannabis Brands
Data for this report comes from real-time sales reporting by participating cannabis retailers via their point-of-sale systems, which are linked up with Headset’s business intelligence software. Headset’s data is very reliable, as it comes digitally direct from our partner retailers. However, the potential does exist for misreporting in the instance of duplicates, incorrectly classified products, inaccurate entry of products into point-of-sale systems, or even simple human error at the point of purchase. Thus, there is a slight margin of error to consider. Brands listed on this page are ranked in the top twenty within the market and product category by total retail sales volume.

