.svg)

Sep-2026
Sales
Trend
6-Month
Product Count
SKUs
Avg Price
YoY Sales Change
YoY Price Change


Market Insights Snapshot
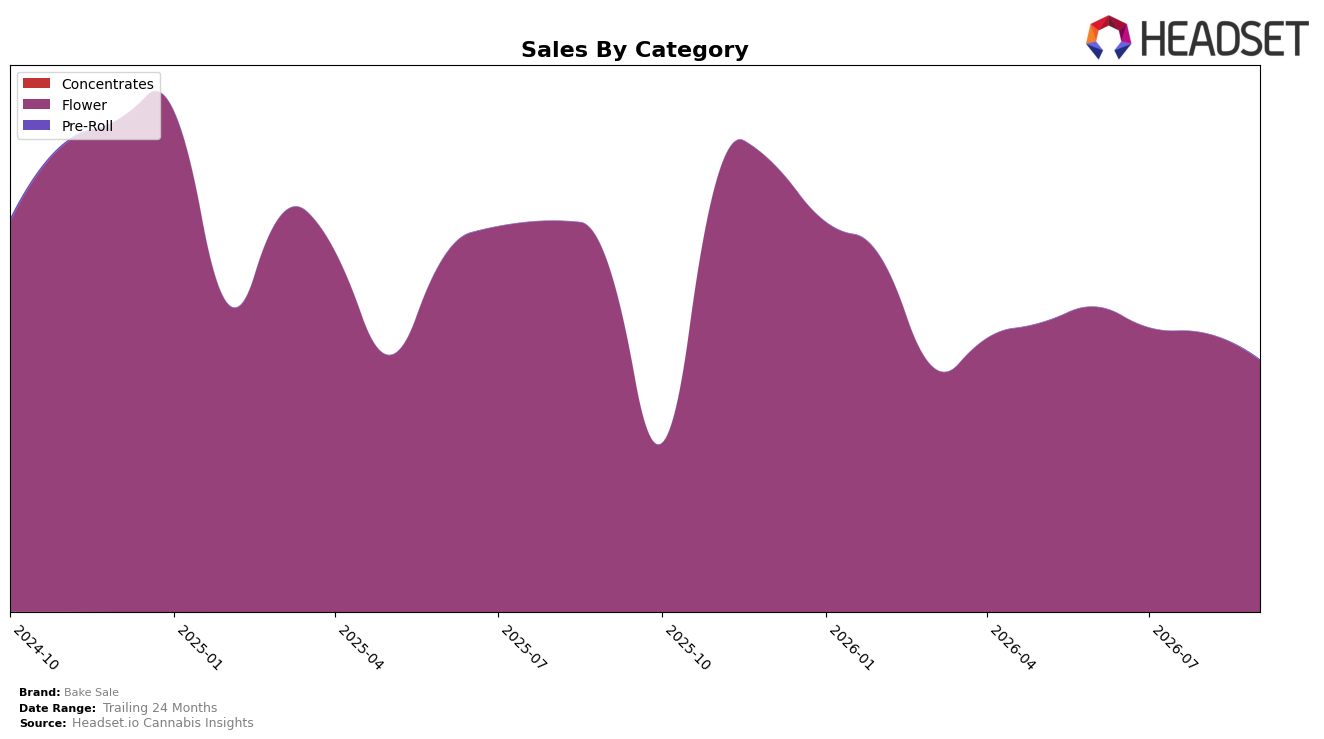
Bake Sale concentrated 99.69% of September 2026 sales in Flower, while Pre-Roll held 0.31% share; within Flower, year-over-year sales fell 27.70% and month-over-month declined 9.77%. Average price rose 6.74% YoY to $79.44 alongside a 27.47% YoY brand sales contraction, and Flower’s average price at $79.95 sat above the brand average, implying mix tilt toward higher-priced SKUs as volume softened. With Flower ranked 6 in British Columbia and Flower’s share near-total, the combination of share rigidity and double-digit declines suggests category over-exposure rather than substitution into Pre-Roll.
The near-absolute Flower mix at 99.69% paired with a 9.77% MoM drop indicates Bake Sale’s positioning is tied to single-category demand cycles more than cross-category buffering, while the 6.74% YoY price increase during a 27.47% sales decline points to elasticity pressure. Holding rank 6 in British Columbia despite a 27.70% YoY Flower decline signals relative stability against peers but little insulation from category-wide dips; the 0.31% Pre-Roll share and null Pre-Roll growth data imply insufficient secondary placement to offset Flower volatility. The pattern implies that short-term resilience will hinge on price architecture within Flower and that diversification beyond Flower is the primary lever to decouple performance from single-category headwinds.
Competitive Landscape
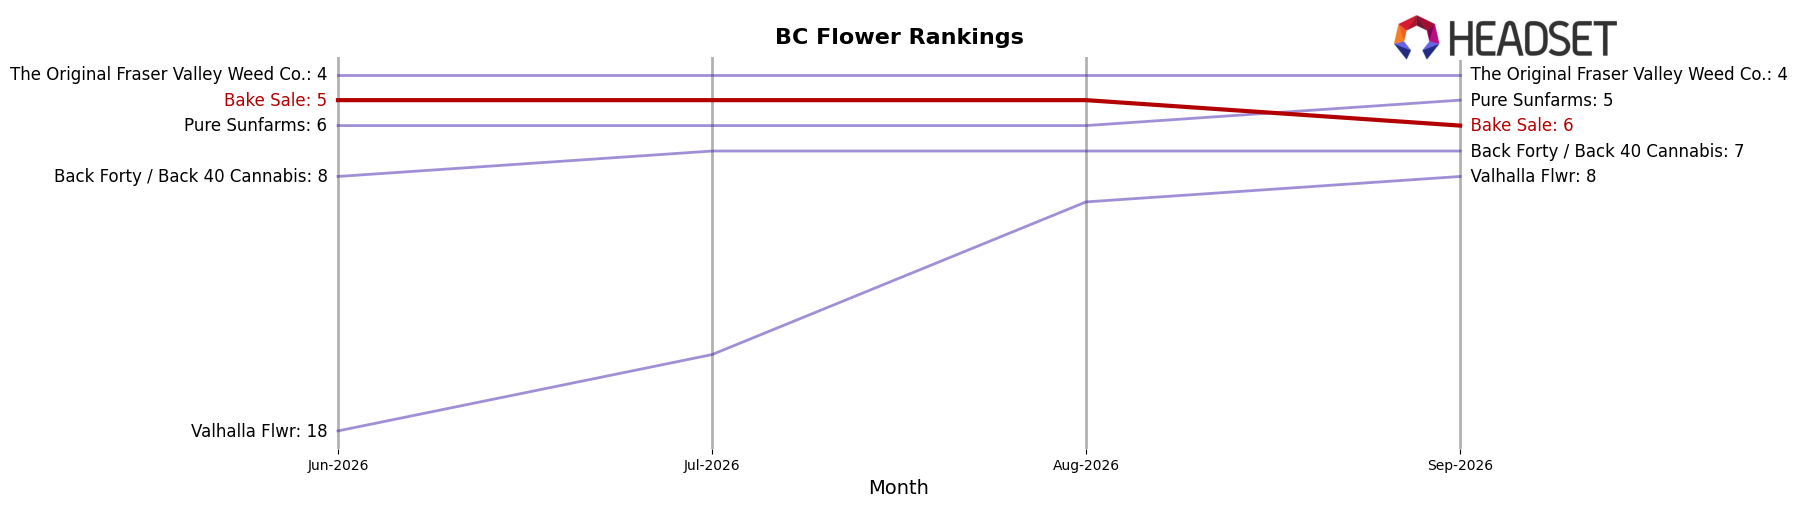
Bake Sale sits at rank #6 in BC Flower for September 2026, down 3 positions year over year from #3 and slipping 1 spot from #5 in June 2026, while its peak of #1 in December 2025 now looks distant by 5 ranks; in contrast, Big Bag O' Buds held #1 with a 0-position YoY change and Good Supply climbed from #8 to #2 alongside a 59.6% YoY sales increase, and Pure Sunfarms improved from #7 to #5 with a 27.1% YoY lift; this rank drift—down 3 YoY and 1 quarter-on-quarter—implies that Bake Sale’s share is being redistributed toward faster-rising incumbents, and without a counter-move the brand risks further slide from the top-5 tier.
Notable Products
All Purpose Flower Sativa (28g) posted the steepest movement in September 2026 with a -9.8% month-over-month decline while holding rank 1, and All Purpose Flower Indica (28g) fell -9.7% at rank 2. Two of the top three SKUs are Flower, concentrating the leaderboard in a single category, and the lone newcomer Baker's Dozen Pre-Roll 13-Pack (6.5g) entered at rank 3 with an undefined prior baseline, signaling a category mix shift despite declines at the top. With rank stability at 1 and 2 alongside parallel sub-10% pullbacks, the pattern implies Bake Sale is trading some volume leadership in Flower for diversification into Pre-Rolls to broaden basket reach.
Top Selling Cannabis Brands






Data for this report comes from real-time sales reporting by participating cannabis retailers via their point-of-sale systems, which are linked up with Headset’s business intelligence software. Headset’s data is very reliable, as it comes digitally direct from our partner retailers. However, the potential does exist for misreporting in the instance of duplicates, incorrectly classified products, inaccurate entry of products into point-of-sale systems, or even simple human error at the point of purchase. Thus, there is a slight margin of error to consider. Brands listed on this page are ranked in the top twenty within the market and product category by total retail sales volume.

