Jun-2026
Sales
Trend
6-Month
Product Count
SKUs
Avg Price
YoY Sales Change
YoY Price Change
Market Insights Snapshot
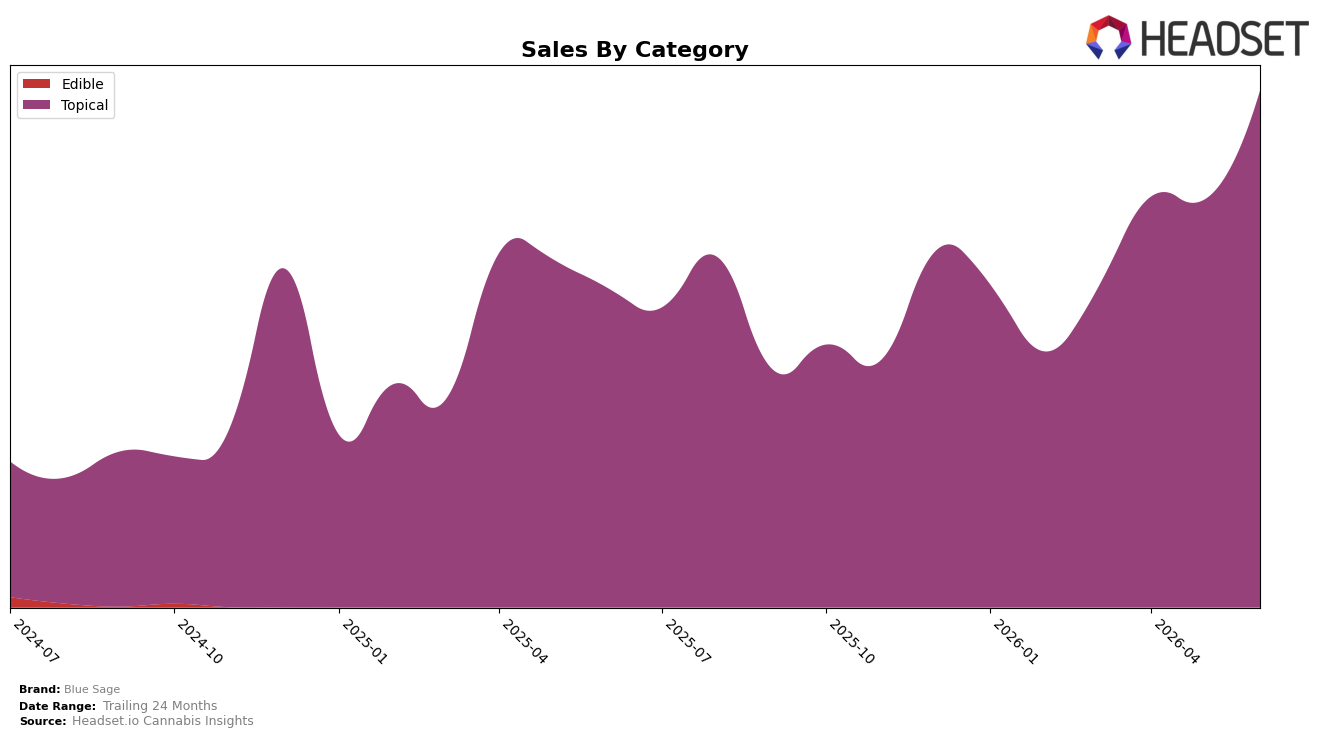
In June 2026, Blue Sage concentrated entirely in Topical, with category share at 100.0% and average price up 3.17% year over year while sales grew 62.07% YoY and 26.70% month over month. Within California Topical, the brand held rank 9, indicating that June 2026 momentum outpaced pricing changes and monthly volatility, implying demand expansion rather than discount-led lift.
The single-category focus, coupled with a rank of 9 in California Topical, implies headroom to climb if June 2026’s 26.70% MoM gain converts into sustained share capture at stable pricing (+3.17% YoY) and continues compounding near the 62.07% YoY pace. This mix and rank pairing suggests Blue Sage is positioned as a price-stable, demand-driven player whose growth vector relies on deepening penetration within Topical rather than diversification in the near term.
Competitive Landscape
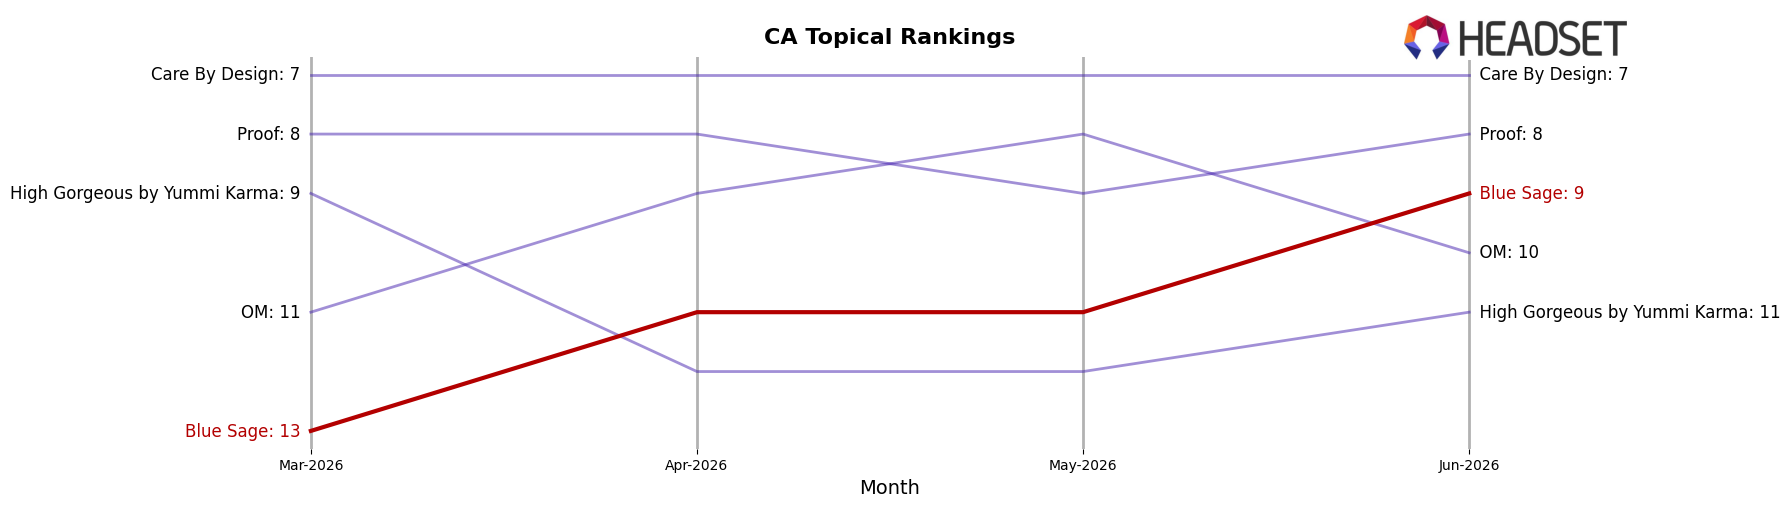
Blue Sage sits at rank #9 in CA Topical with a year-over-year climb from #12, improving 3 positions, and also moving up 4 places from #13 in March 2026 to reach a peak at #9 in June 2026; by contrast, Papa & Barkley held steady at #1 year-over-year while experiencing a -4.6% sales change, and Liquid Flower advanced from #6 to #4 alongside a 58.7% sales increase, indicating Blue Sage’s rank gains are occurring amid both flat leadership and fast-rising mid-tier rivals. With Mary's Medicinals holding at #2 despite a -26.7% sales decline and Carter's Aromatherapy Designs (C.A.D.) slipping from #4 to #5 on -22.2% sales, Blue Sage’s movement from #12 to #9 in June 2026 implies share is being won through displacement of weakening incumbents rather than outpacing the fastest growers like Buddies at a stable #3 with +64.5% sales.
Notable Products
Orange Chai Cream (880mg THC,118ml, 4oz) posted the largest month-over-month gain at 793.7% and entered the top five at rank 4, while The Original Cream (696mg THC, 118ml) fell 10.2% and slipped to rank 3. Citrus Cedar Cream (393mg THC, 50ml) jumped 79.9% to rank 1, and The Original Cream (322mg THC, 50ml) rose 85.8% to share rank 2 alongside Citrus Cedar Cream (1000mg THC, 4oz), which grew 28.9% with $7,399 in June 2026 sales. With four of the top ten as Topical SKUs and three distinct sizes now clustered in ranks 1–4, the mix implies Blue Sage is consolidating around topical relief formats with momentum concentrated in mid-to-high potency creams.
Top Selling Cannabis Brands
Data for this report comes from real-time sales reporting by participating cannabis retailers via their point-of-sale systems, which are linked up with Headset’s business intelligence software. Headset’s data is very reliable, as it comes digitally direct from our partner retailers. However, the potential does exist for misreporting in the instance of duplicates, incorrectly classified products, inaccurate entry of products into point-of-sale systems, or even simple human error at the point of purchase. Thus, there is a slight margin of error to consider. Brands listed on this page are ranked in the top twenty within the market and product category by total retail sales volume.

