.svg)

Sep-2026
Sales
Trend
6-Month
Product Count
SKUs
Avg Price
YoY Sales Change
YoY Price Change


Where to Buy
High Desert Pure is stocked at 354 licensed dispensaries across Oregon and California, 270 of them in Oregon, with the deepest coverage in Portland, Eugene, Bend, Salem, and Ontario. Search by ZIP code or city below to find the closest one, or filter by product type if you are after a specific format.
Market Insights Snapshot
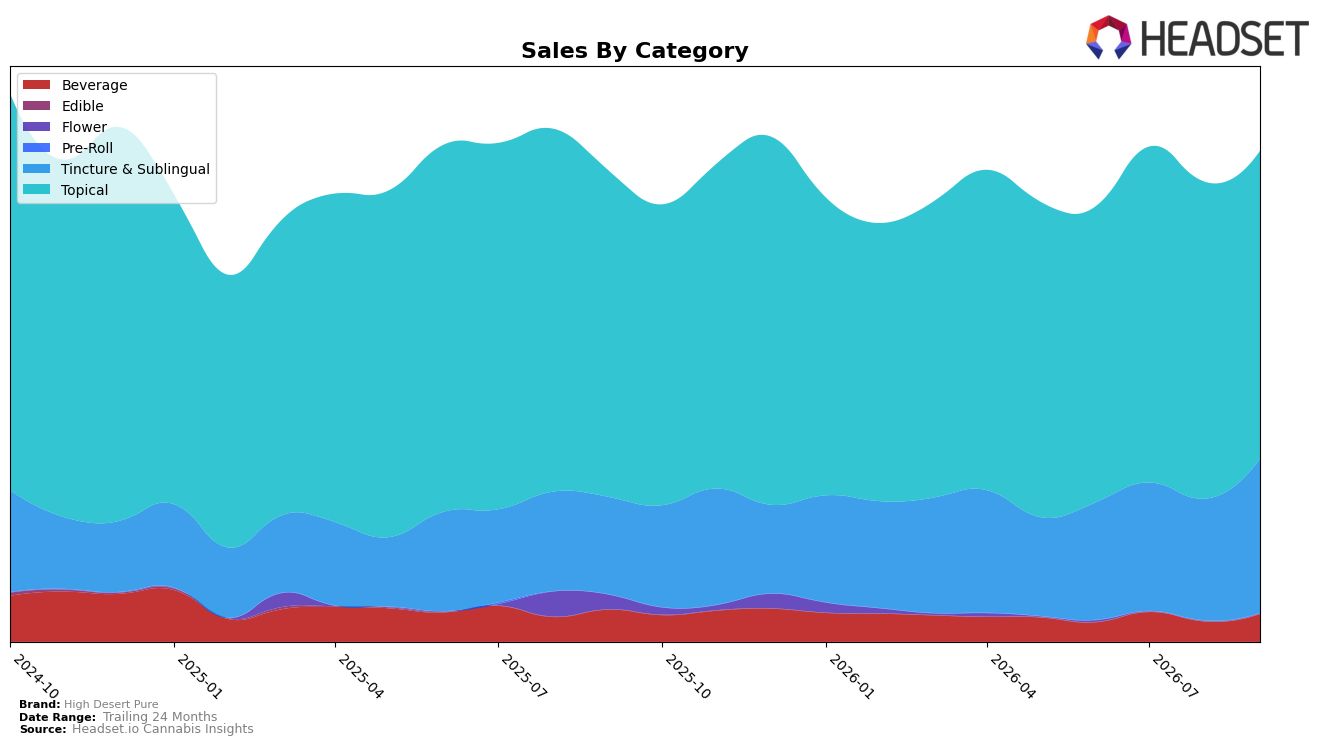
High Desert Pure concentrated 62.89% of September 2026 sales in Topical, where year-over-year declined 5.81% and month-over-month slipped 2.90%, while Tincture & Sublingual expanded to 31.47% share on 58.82% YoY and 26.88% MoM growth; Beverage remained a small 5.64% share with a 13.30% YoY decline but a 37.31% MoM jump. Despite a 1.71% YoY decrease in average price to $37.47 and Topical softness, total brand sales were up 4.12% YoY as Tincture & Sublingual gains more than offset Topical declines, implying a portfolio rebalancing away from a single-category dependency in Oregon.
Holding rank 1 in Topical in Oregon while the category contracted 5.81% YoY and 2.90% MoM indicates leadership in a softening core, and the 58.82% YoY and 26.88% MoM surge in Tincture & Sublingual suggests the brand is reallocating demand to higher-velocity formats. With Beverage down 13.30% YoY but up 37.31% MoM and the overall 1.71% YoY price decrease, the mix shift implies a strategy prioritizing volume capture and category diversification to sustain growth momentum if Topical headwinds persist.
Competitive Landscape
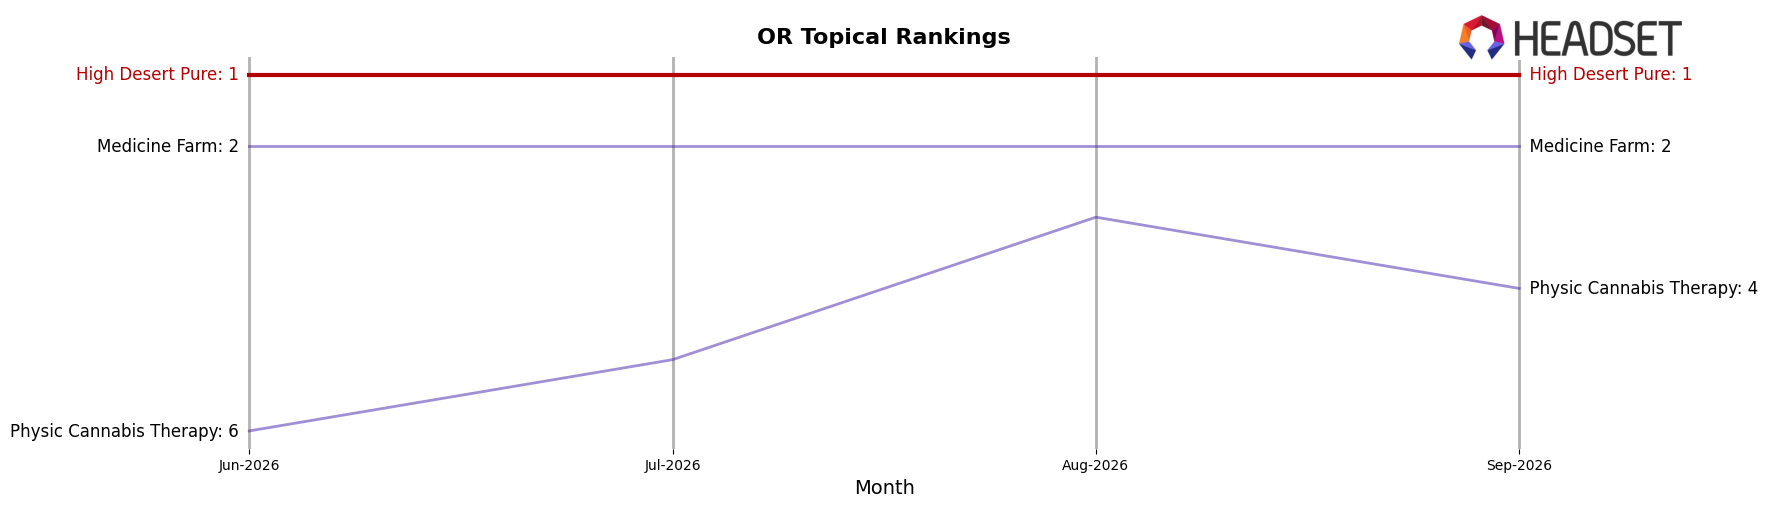
High Desert Pure holds rank #1 in OR Topical in September 2026, unchanged from rank #1 in September 2025, and has also remained #1 since June 2026, while its peak rank of #1 was reached in September 2026; in contrast, Medicine Farm stayed at #2 year over year with a -5.9% sales change and Buddies climbed from #4 to #3 with a 58.7% YoY increase, indicating that stability at the top coexists with faster momentum just below. With Physic Cannabis Therapy jumping from #7 to #4 on 163.6% YoY growth and Synergy Skin Worx holding #5 with roughly flat 0.1% YoY change, the competitive pattern points to an intensifying chase pack where multiple brands are compressing the gap even as the leader’s rank stays fixed—implying that High Desert Pure’s steady #1 trajectory masks rising share risk if sub-leaders continue to convert growth into rank gains.
Notable Products
CBD/THC 1:1 Clinical Strength Menthol Lotion (750mg CBD, 750mg THC, 3.5oz) posted the steepest decline at -24.4% and slid to rank 4 in September 2026, while CBD/THC 1:1 Ginger Lime Lotion (750mg CBD, 750mg THC, 3.5fl oz) rose 16.1% to hold rank 1. Across the lineup, Topical SKUs occupy four of the top ten but split between gains of 16.8% and 18.0% at ranks 8 and 5 versus declines of -24.4% and -28.5% at ranks 4 and 6, indicating demand is concentrating around specific formulations rather than the category as a whole. Tincture & Sublingual shows mixed momentum with Celebrate Chocolate Coconut Full Spectrum Tincture down -32.0% at rank 2 while another tincture at rank 3 grew 10.5%, implying shoppers are trading within the form factor toward targeted effect blends over general-use offerings. The pattern implies High Desert Pure is tilting toward a narrower set of hero SKUs in Topicals and effect-forward tinctures, which suggests focusing inventory and promotion on winners while pruning underperforming variants could improve velocity and margin.
Top Selling Cannabis Brands






Data for this report comes from real-time sales reporting by participating cannabis retailers via their point-of-sale systems, which are linked up with Headset’s business intelligence software. Headset’s data is very reliable, as it comes digitally direct from our partner retailers. However, the potential does exist for misreporting in the instance of duplicates, incorrectly classified products, inaccurate entry of products into point-of-sale systems, or even simple human error at the point of purchase. Thus, there is a slight margin of error to consider. Brands listed on this page are ranked in the top twenty within the market and product category by total retail sales volume.

