.svg)

Sep-2026
Sales
Trend
6-Month
Product Count
SKUs
Avg Price
YoY Sales Change
YoY Price Change


Where to Buy
OM is stocked at 38 licensed dispensaries across California, with the deepest coverage in San Francisco, Vista, Healdsburg, Los Angeles, and Santa Barbara. Search by ZIP code or city below to find the closest one.
Market Insights Snapshot
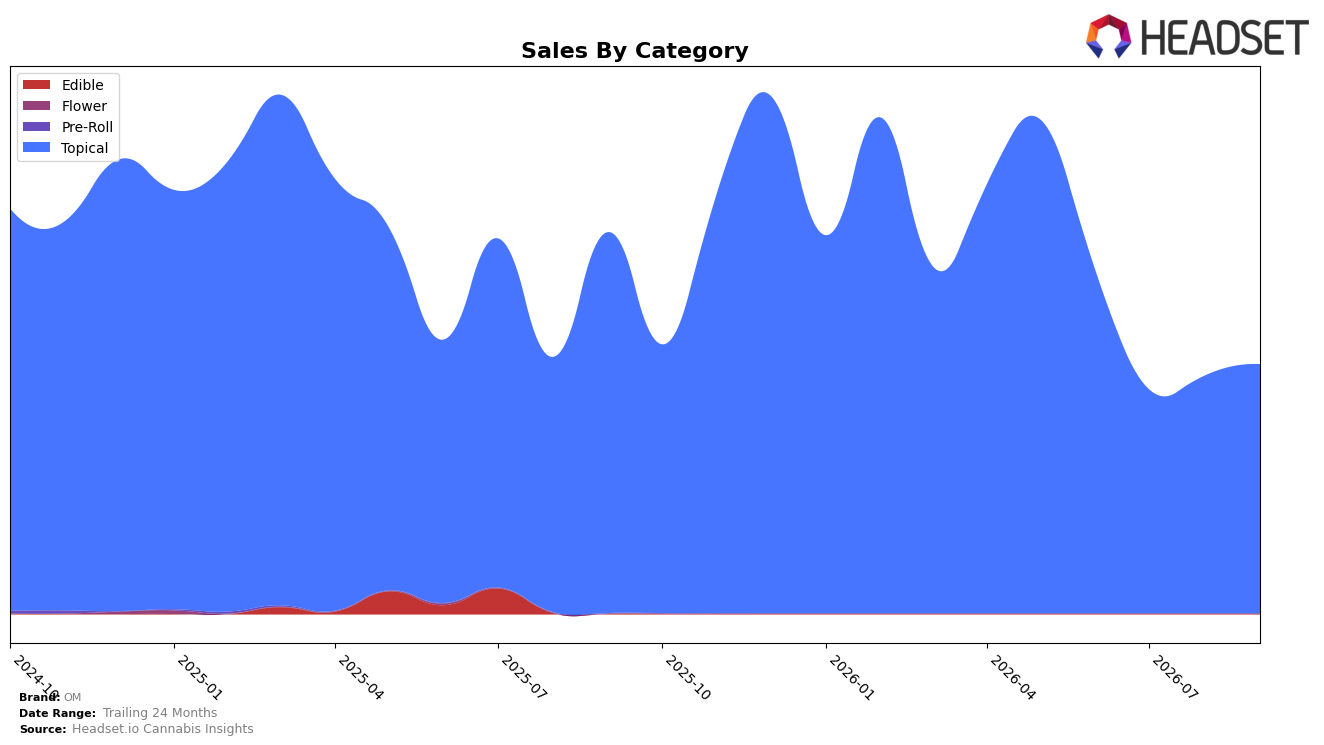
OM concentrated 100.0% of September 2026 sales in Topical, with that category up 4.83% month over month but down 34.70% year over year; average price moved to $17.12 as price declined 7.82% YoY. Within California Topical, OM held rank 11, while overall brand sales trailed by 34.70% YoY despite a category-level MoM lift of 4.83%. The pattern implies OM is operating as a single-category specialist whose modest MoM uptick has not offset a double-digit YoY contraction, anchoring short-term stabilization but limiting diversification-driven recovery.
With a 100.0% reliance on Topical and a rank of 11 in California, the 4.83% MoM improvement paired with a 7.82% YoY price decrease suggests price-led volume support that has not closed the 34.70% YoY sales gap. Holding a mid-pack rank at 11 while prices declined 7.82% YoY indicates positioning pressure where price elasticity is working tactically month to month, but strategic exposure to a single category leaves OM vulnerable to further share erosion if Topical demand softens. The implication is that OM’s current stance favors defensive pricing to preserve placement rather than mix expansion, making future gains contingent on either rank advancement within Topical or re-entry into adjacent categories.
Competitive Landscape
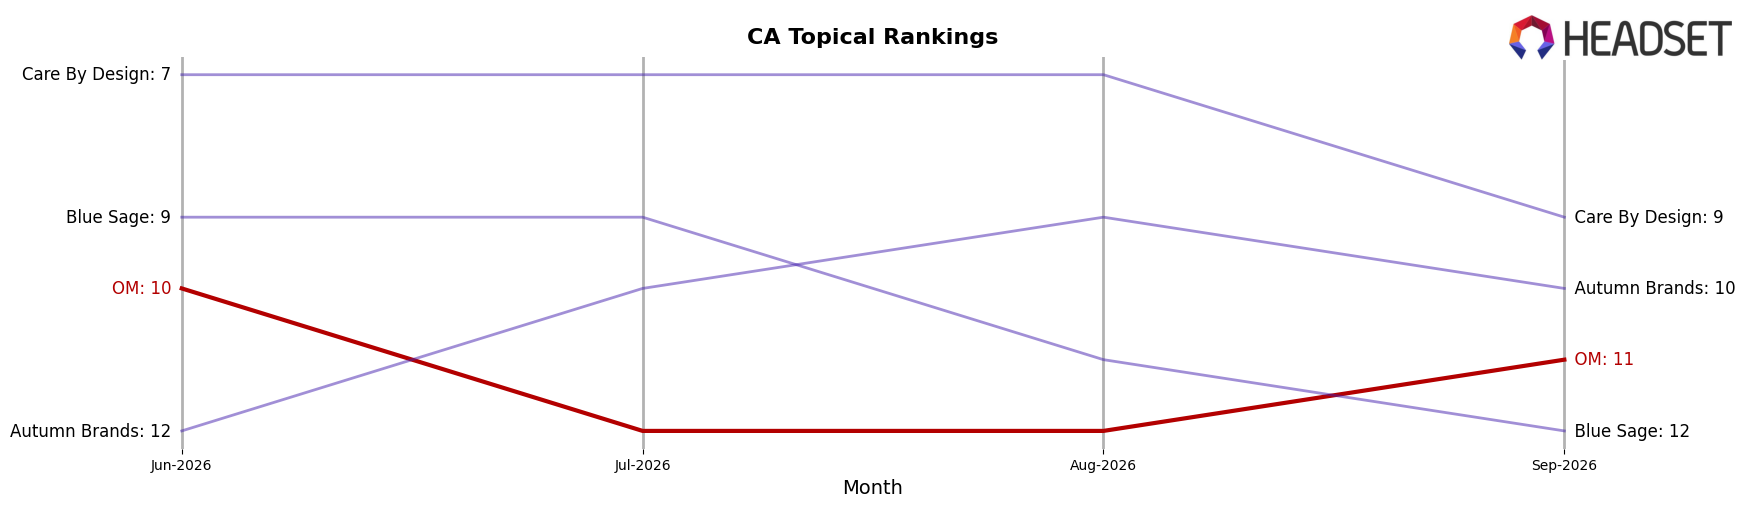
OM sits at #11 in CA Topical in September 2026, slipping 1 position year over year from #10 while holding flat versus three months ago at #10 to #11, and its peak of #8 in May 2026 marks a 3-rank retreat since that high. In contrast, Papa & Barkley held #1 year over year at #1 despite a -1.5% sales change, and Sweet ReLeaf (CA) climbed from #5 to #4 alongside a +30.2% sales increase, indicating OM is losing relative position as faster-rising peers consolidate the top five. The pattern of a flat 3‑month rank against a 1‑spot YoY decline, paired with competitors posting double‑digit growth (e.g., Buddies at #3 with +15.9%), implies OM’s rank trajectory is tilting toward mid‑tier persistence rather than upper‑tier recovery unless mix or velocity shifts.
Notable Products
CBD/THC 1:1 Lavender Epsom Bath Salts (25mg CBD, 25mg THC, 6.5oz) posted the steepest decline at -14.2% MoM while falling to rank 3, contrasted by Just Peachy Rosin Bath Bomb (100mg) surging +45.5% MoM into a shared rank 5 position; this simultaneous drop in a legacy salt SKU and rise in a novelty rosin SKU signals substitution within the bath ritual. Arnica Relief Bath Bomb (100mg) rose +18.8% MoM to rank 1 while CBD/THC 1:1 Arnica Pain Relief Epsom Bath Salts (25mg CBD, 25mg THC) jumped +41.2% MoM at rank 4, and five of the top ten are Bath Bomb SKUs, indicating rank consolidation around bomb formats. Fragrance Free Extra Strength Bath Bomb (1000mg) in rank 2 grew a modest +1.4% MoM on $2,879, while CBN/THC 1:10 Sweet Dreams Bath Bomb (100mg THC, 10mg CBN) advanced +24.4% MoM at a shared rank 8, implying that higher-dose and functional add-ins are concentrating demand toward differentiated bomb offerings.
Top Selling Cannabis Brands






Data for this report comes from real-time sales reporting by participating cannabis retailers via their point-of-sale systems, which are linked up with Headset’s business intelligence software. Headset’s data is very reliable, as it comes digitally direct from our partner retailers. However, the potential does exist for misreporting in the instance of duplicates, incorrectly classified products, inaccurate entry of products into point-of-sale systems, or even simple human error at the point of purchase. Thus, there is a slight margin of error to consider. Brands listed on this page are ranked in the top twenty within the market and product category by total retail sales volume.

