Jun-2026
Sales
Trend
6-Month
Product Count
SKUs
Avg Price
YoY Sales Change
YoY Price Change
Market Insights Snapshot
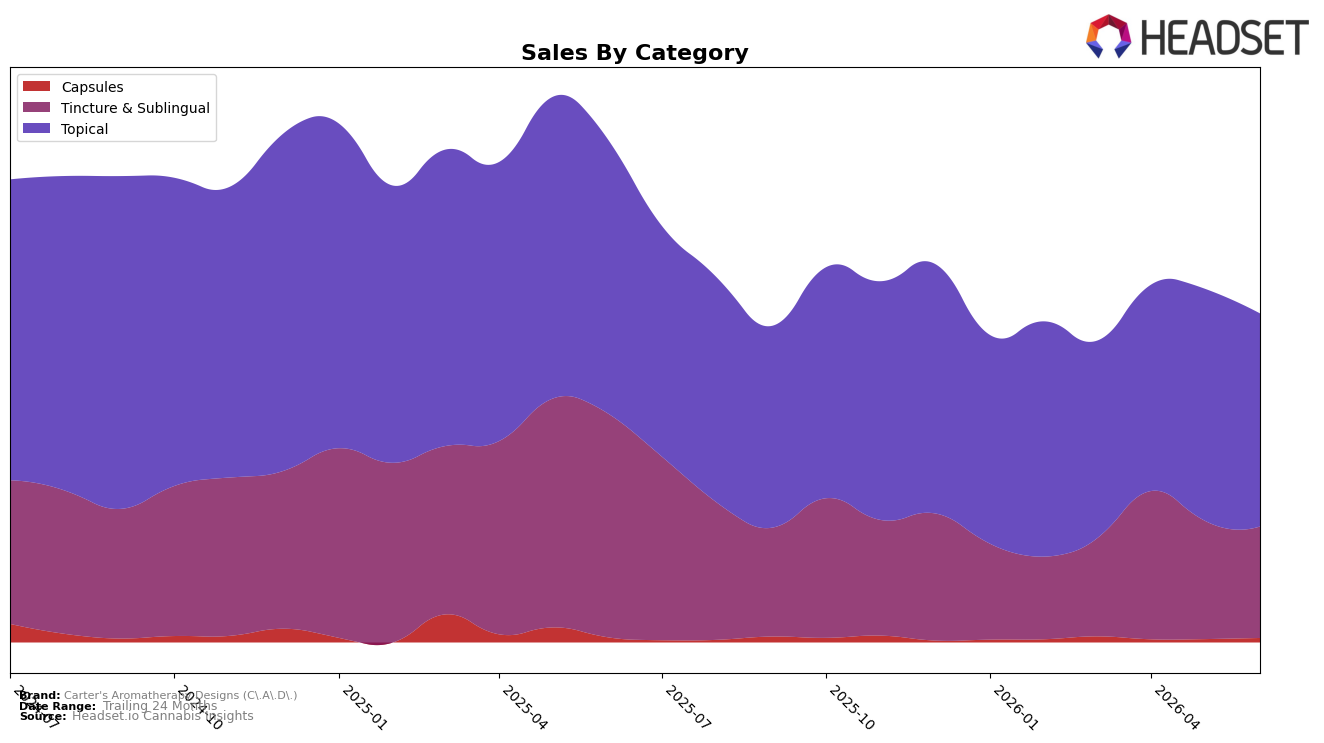
In June 2026, Carter's Aromatherapy Designs (C.A.D.) concentrated 64.85% of sales in Topical with a year-over-year decline of 22.22% and a month-over-month drop of 8.16%, while Tincture & Sublingual held 33.88% share but fell 50.24% YoY and 5.89% MoM. Capsules remained a niche at 1.28% share with a 12.89% YoY decline but a 37.04% MoM lift, and the brand’s average price rose 11.74% YoY alongside an overall sales contraction of 34.60% YoY. The pattern implies the brand is consolidating around Topical despite sequential pressure, with Tincture & Sublingual acting as the drag on total performance and Capsules signaling a small but potentially scalable rebound pocket.
With Topical ranked 5 in California and carrying nearly two-thirds of mix, the 8.16% MoM decline in that anchor category weighs more on month-to-month outcomes than the 5.89% MoM slip in Tincture & Sublingual, yet the 50.24% YoY contraction in Tincture & Sublingual explains most of the 34.60% brand-level YoY decline. The 11.74% YoY increase in average price alongside a 22.22% YoY volume pressure signal a trade-up or assortment tilt in Topical, while the 37.04% MoM rise in Capsules at a $17.41 price point suggests an entry-price adjacency that can diversify beyond the 64.85% Topical concentration. The implication is a positioning anchored in premium-priced Topical where maintaining a top-5 foothold hinges on stabilizing sequential Topical trends, while selectively nurturing Capsules can offset volatility from Tincture & Sublingual without diluting price architecture.
Competitive Landscape
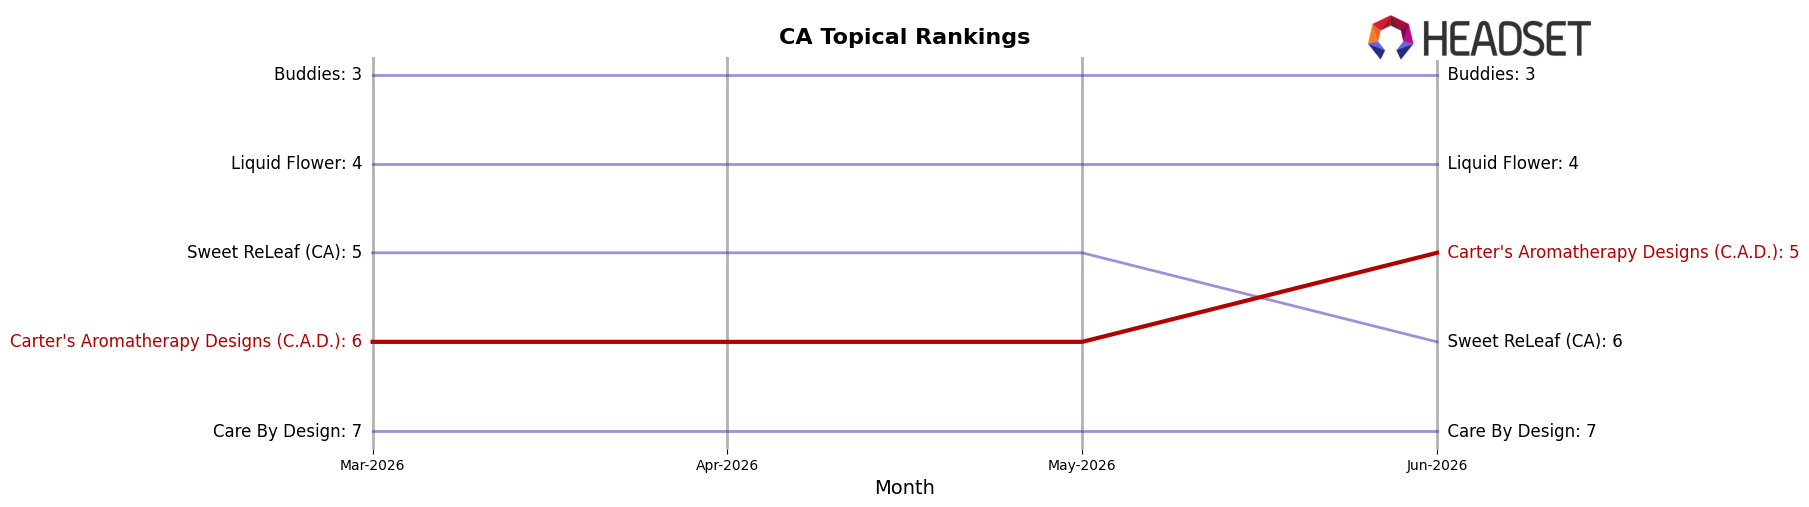
Carter's Aromatherapy Designs (C.A.D.) sits at rank #5 in CA Topical in June 2026, slipping 1 position year over year from #4, and improving 1 spot versus March 2026 when it was #6; this comes after a peak at #4 in January 2026. In contrast, Liquid Flower rose from #6 to #4 while posting 58.7% YoY sales growth, and Buddies held #3 with 64.5% YoY growth, whereas category leader Papa & Barkley stayed at #1 but with a 4.6% YoY sales decline. The pattern implies C.A.D.’s flat-to-declining rank trajectory amid faster-rising peers points to share pressure intensifying unless the brand re-accelerates against competitors gaining ranks and growth.
Notable Products
Tranquility Tincture (1000mg THC, 2mg CBD, 29ml) led June 2026 with an 84.6% month-over-month surge into rank 3, while CBD/THC Everyday Tincture (200mg CBD, 4.4mg THC, 1oz) also climbed 52.7% to rank 4, whereas CBD/THC 1:1 Tincture (300mg CBD, 300mg THC, 1oz) fell 46.1% to rank 7. Topicals remained anchored by CBD/THC 2:1 Rasta Pain Cream (1000mg CBD, 500mg THC, 2oz) at rank 1 with a 1.9% lift, even as CBD/THC 2:1 Anne's Best Lotion (1000mg CBD, 500mg THC) dropped 45.5% to rank 6, concentrating momentum into one flagship while another weakens. With two Tincture & Sublingual SKUs inside the top five and three Topicals in the top ten, mix shift favors higher-velocity tinctures despite Topicals still owning the top rank and the only five-figure dollar line at $21,569. The pattern implies Carter's Aromatherapy Designs (C.A.D.) is pivoting toward a tincture-led growth lane while maintaining a single topical anchor, suggesting resource reallocation from lower-yield topicals to scaling the surge in Tranquility and Everyday.
Top Selling Cannabis Brands
Data for this report comes from real-time sales reporting by participating cannabis retailers via their point-of-sale systems, which are linked up with Headset’s business intelligence software. Headset’s data is very reliable, as it comes digitally direct from our partner retailers. However, the potential does exist for misreporting in the instance of duplicates, incorrectly classified products, inaccurate entry of products into point-of-sale systems, or even simple human error at the point of purchase. Thus, there is a slight margin of error to consider. Brands listed on this page are ranked in the top twenty within the market and product category by total retail sales volume.

