.svg)

Sep-2026
Sales
Trend
6-Month
Product Count
SKUs
Avg Price
YoY Sales Change
YoY Price Change


Market Insights Snapshot
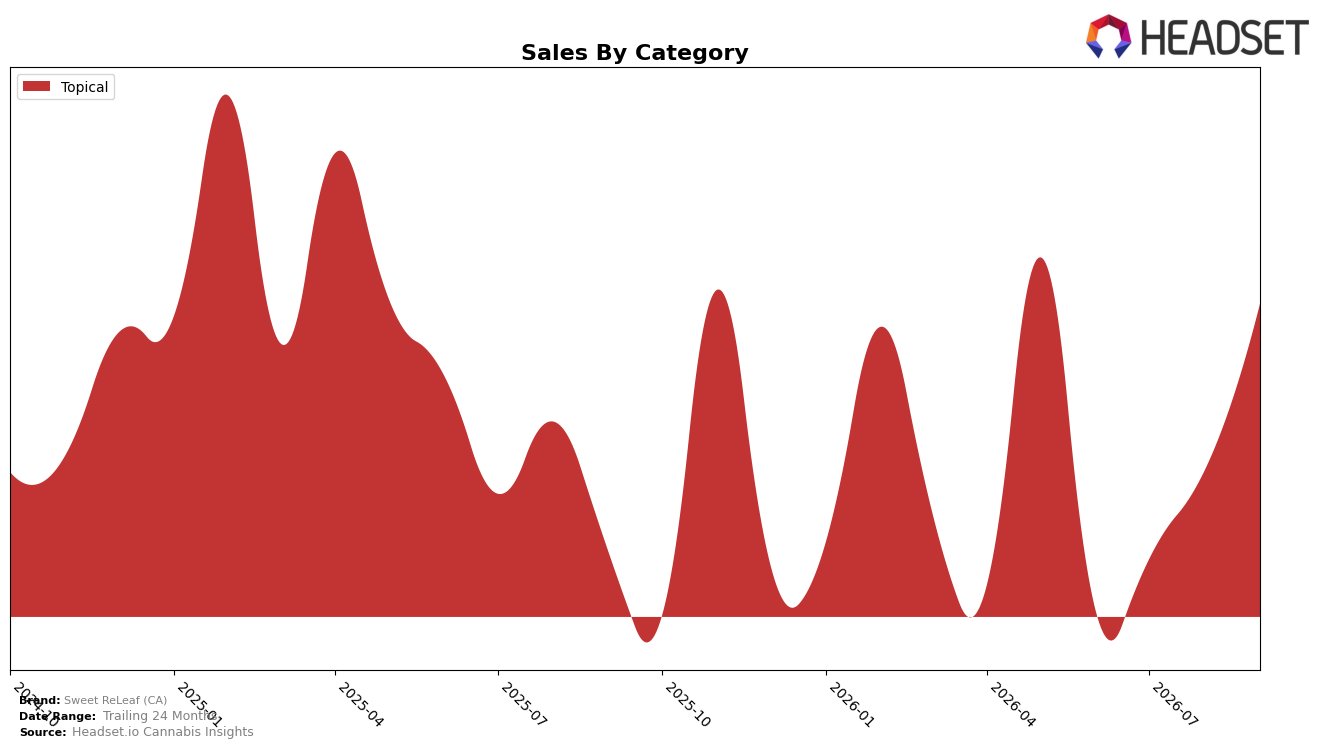
In September 2026, Sweet ReLeaf (CA) operated as a single-category brand with Topical accounting for 100.0% of sales, pairing 30.2% year-over-year growth with an 18.5% month-over-month lift and an 11.8% YoY increase in average price at $54.50. Within California Topicals, the brand held rank 4, indicating upward velocity that outpaced its own pricing inflation and aligned with a concentrated mix where every incremental gain directly raised total share. The pattern implies scale is being driven by depth, not breadth: concentrating entirely in Topicals magnifies MoM and YoY momentum and suggests price tolerance is intact at current points.
The shift toward a fully concentrated Topical portfolio, combined with a 30.2% YoY sales increase and an 18.5% MoM uptick, positions Sweet ReLeaf (CA) to compete on efficacy signaling and repeat usage rather than assortment width, as evidenced by holding rank 4 in California Topicals while raising average price by 11.8%. With 100.0% category dependence, the September 2026 outcome implies share gains will be sensitive to rank movements within a single shelf, so sustained price realization near $54.50 must be paired with visibility tactics that convert rank 4 into higher placement to prevent growth from hinging solely on repeat buyers.
Competitive Landscape
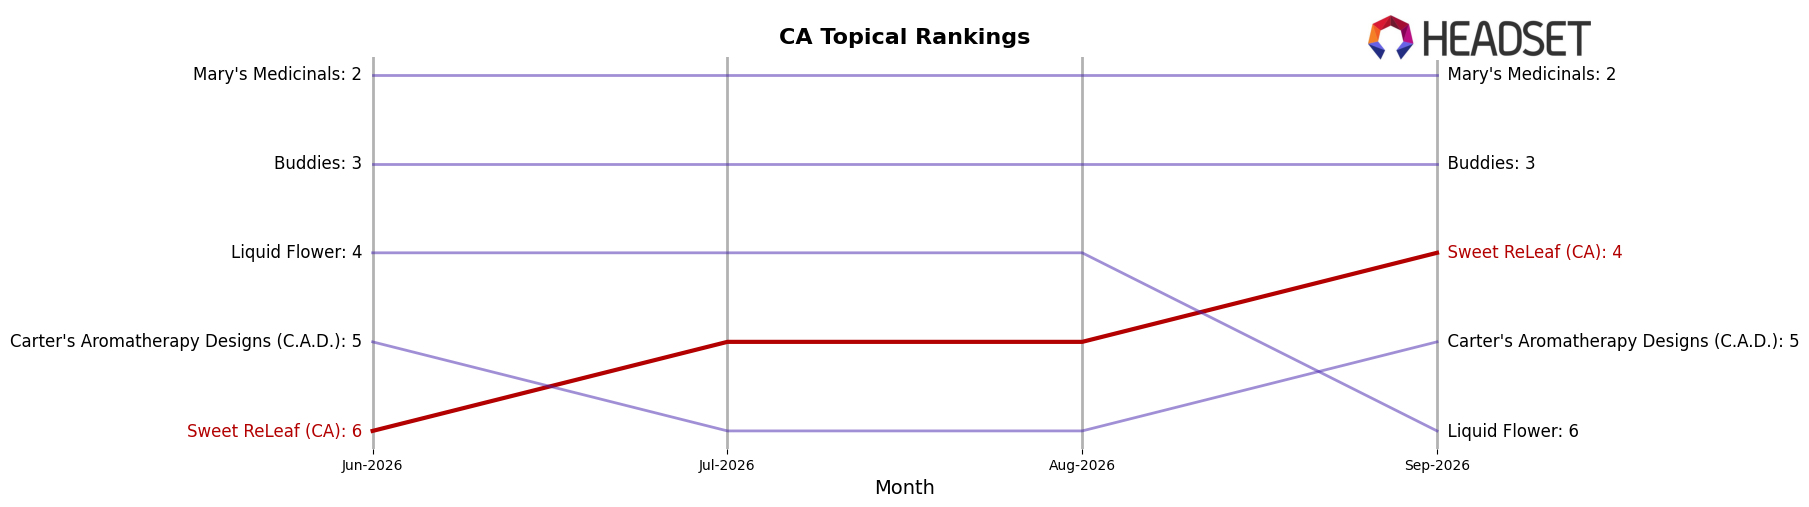
Sweet ReLeaf (CA) sits at rank #4 in CA Topical as of September 2026, up 1 position YoY from #5, and 2 positions higher than its June 2026 rank of #6; this coincides with a peak rank of #4 in September 2026, indicating upward momentum within a relatively static top tier. In contrast, Papa & Barkley held steady at #1 from last year to September 2026 while experiencing a -1.5% YoY sales change, and Buddies maintained #3 with a 15.9% YoY sales increase, placing Sweet ReLeaf (CA) between a flat leader and a growing mid-tier rival. Meanwhile, Carter's Aromatherapy Designs (C.A.D.) slipped from #4 to #5 YoY alongside a 20.5% YoY sales increase, indicating share reshuffling where Sweet ReLeaf (CA) advanced in rank despite mixed competitor growth rates; the trajectory implies Sweet ReLeaf (CA) is converting relative share gains into rank improvement even as faster-growing peers apply pressure just above and below.
Notable Products
CBD:THC 1:14 Comfort Warm Dry Oil (6.5mg CBD, 90mg THC, 10ml, 0.33oz) posted the largest swing in September 2026 with a +350% month-over-month jump while moving to rank 5, contrasting with CBD/THC 14:1 Comfort + Extra Strength Body Butter (272mg THC, 19.5mg CBD, 50ml) which fell -89.7% and slid to rank 8. CBD/THC 1:14 Comfort + Extra Strength Body Butter (37.5mg CBD, 525mg THC, 100ml) rose +24.1% and held rank 1, as CBD/THC 1:14 Body Butter Comfort Plus Creme (18.75mg CBD, 263mg THC, 50ml) declined -10.6% at rank 2; six of the top eight are Body Butters, indicating concentration in 1:14 topical formats. With ranks 1 through 3 occupied by 1:14 Body Butter variants posting changes from +44.7% to -10.6% and Dry Oils emerging at ranks 4–5, the pattern implies Sweet ReLeaf (CA) is extending beyond its Body Butter core into smaller-size Dry Oils to capture incremental trial and diversify price points, even as one 14:1 variant contracts sharply.
Top Selling Cannabis Brands






Data for this report comes from real-time sales reporting by participating cannabis retailers via their point-of-sale systems, which are linked up with Headset’s business intelligence software. Headset’s data is very reliable, as it comes digitally direct from our partner retailers. However, the potential does exist for misreporting in the instance of duplicates, incorrectly classified products, inaccurate entry of products into point-of-sale systems, or even simple human error at the point of purchase. Thus, there is a slight margin of error to consider. Brands listed on this page are ranked in the top twenty within the market and product category by total retail sales volume.

