.svg)

Sep-2026
Sales
Trend
6-Month
Product Count
SKUs
Avg Price
YoY Sales Change
YoY Price Change


Where to Buy
Chill Medicated is stocked at 619 licensed dispensaries across Michigan, Massachusetts, and 2 other states, 460 of them in Michigan, with the deepest coverage in New Buffalo, Detroit, Grand Rapids, Monroe, and Ann Arbor. Search by ZIP code or city below to find the closest one, or filter by product type if you are after a specific format.
Market Insights Snapshot
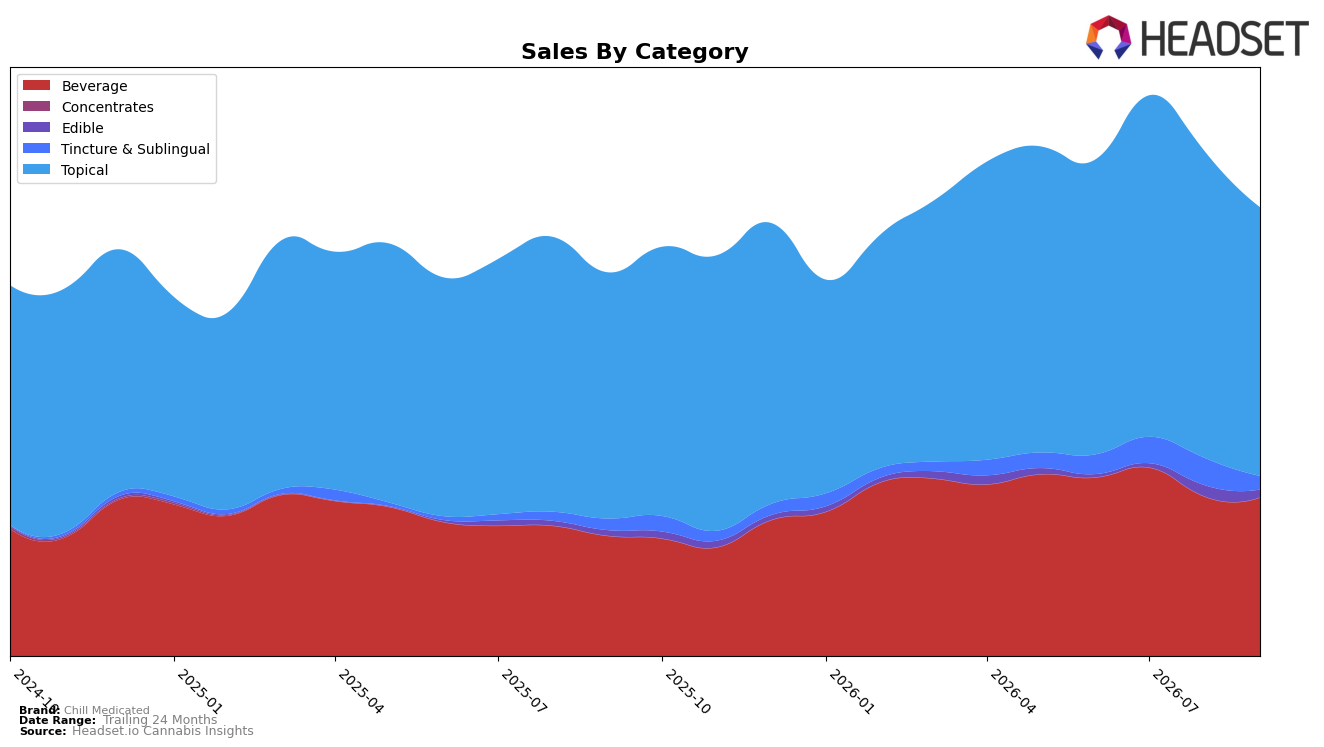
Chill Medicated concentrated 59.96% of September 2026 sales in Topical with 9.19% YoY growth but a -12.38% MoM dip, while Beverage held 35.37% share with 32.02% YoY growth and a softer -0.61% MoM move; smaller lines swung harder, with Tincture & Sublingual at 2.96% share growing 17.05% YoY yet falling -50.88% MoM, and Edible at 1.70% share rising 42.23% YoY but sliding -30.78% MoM. Against an overall brand sales increase of 17.05% YoY and a -28.84% YoY drop in average price to $21.66, the mix signals volume-led gains anchored in Topical rank 1 within Michigan coupled with diversified contribution from Beverage; the thesis is that September 2026 growth is being pulled by category breadth while near-term volatility sits in the tail categories.
The shift toward a two-pillar portfolio—Topical at 59.96% share and Beverage at 35.37%—implies defensibility in Topical leadership (rank 1) and incremental reach from Beverage where YoY growth at 32.02% outpaces Topical’s 9.19%, suggesting relative momentum even as MoM softness differs (-0.61% vs -12.38%). With Tincture & Sublingual and Edible combining only 4.66% share despite YoY rises of 17.05% and 42.23%, their -50.88% and -30.78% MoM drops indicate limited buffering capacity; the implication is that pricing-driven accessibility (average price -28.84% YoY) is enabling volume expansion, but sustaining September 2026 trajectory will rely on stabilizing Topical MoM while converting Beverage’s faster YoY into steadier month-on-month share gains.
Competitive Landscape
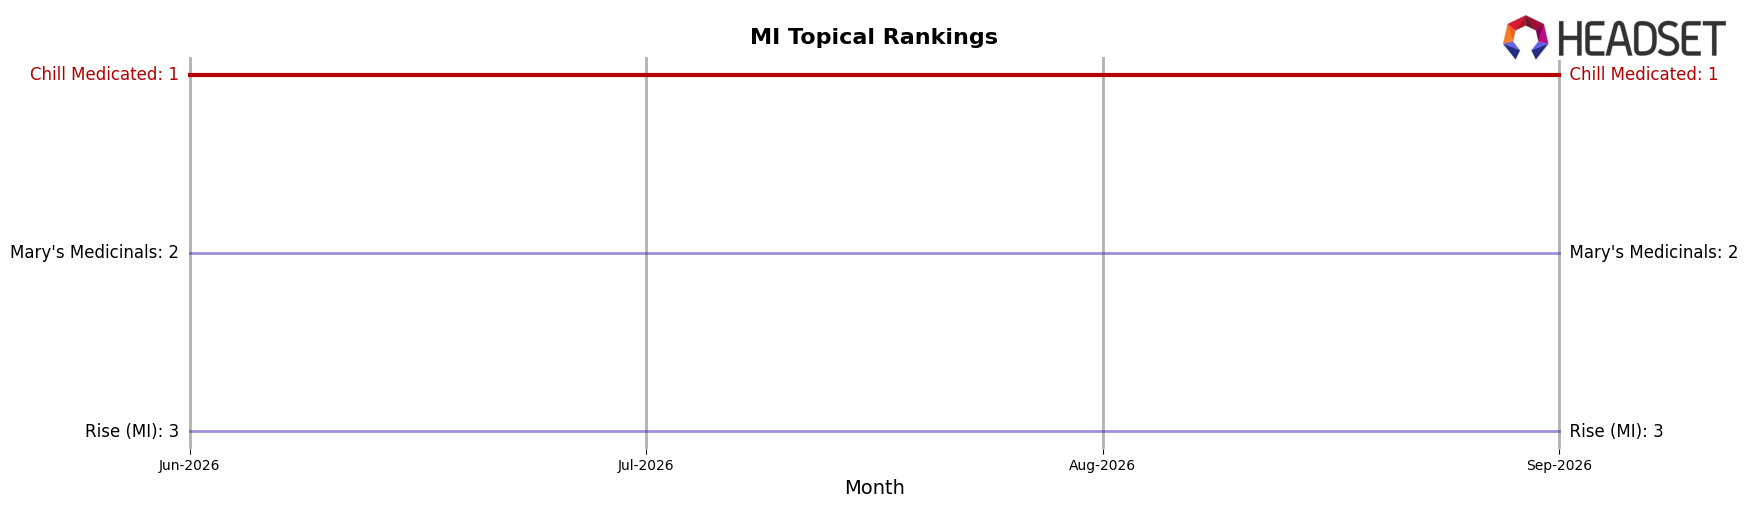
Chill Medicated holds rank #1 in MI Topical in September 2026, unchanged from #1 a year earlier, while Mary's Medicinals remains at #2 year over year with sales down 13.0%, and Vlasic Labs moved up from #5 to #4 on 37.3% YoY sales growth; meanwhile, Rise (MI) stayed at #3 with sales down 33.0% YoY and Lit Labs slipped from #6 to #5 with sales down 26.6% YoY. The combination of a stable #1 rank across September 2025 to September 2026 and competitors either contracting (−13.0% to −33.0%) or advancing without overtaking (Vlasic Labs +1 rank) implies Chill Medicated’s position is being defended by relative share retention rather than absolute category expansion.
Notable Products
Chill To Go - Blue Razz Live Rosin Syrup (100mg THC, 4oz) posted the steepest decline at -25.0% month over month and sat at rank 9, while CBD/THC 1:1 Extreme X Body Rub (2000mg CBD, 2000mg THC, 2.5oz) fell -12.1% yet held rank 1 with $243,929 in September 2026. Beverage ranks 2 through 9 were dominated by syrups, and four SKUs in the top seven logged declines between -9.1% and -15.0%, which concentrates risk in a softening syrup segment. Compared with the -8.8% for Chill To Go - Strawberry Rosin Syrup (200mg) at rank 2 and the -12.9% for Chill To Go - Grape Live Rosin Syrup (200mg) at rank 3, the topical’s rank stability despite a double-digit drop signals reliance on one flagship and a need to rebalance away from multiple mid-tier beverages. The pattern implies September 2026 mix strength rests on a single Topical leader while syrup breadth is diluting momentum, pointing to portfolio pruning or format diversification.
Top Selling Cannabis Brands






Data for this report comes from real-time sales reporting by participating cannabis retailers via their point-of-sale systems, which are linked up with Headset’s business intelligence software. Headset’s data is very reliable, as it comes digitally direct from our partner retailers. However, the potential does exist for misreporting in the instance of duplicates, incorrectly classified products, inaccurate entry of products into point-of-sale systems, or even simple human error at the point of purchase. Thus, there is a slight margin of error to consider. Brands listed on this page are ranked in the top twenty within the market and product category by total retail sales volume.

