Jun-2026
Sales
Trend
6-Month
Product Count
SKUs
Avg Price
YoY Sales Change
YoY Price Change
Market Insights Snapshot
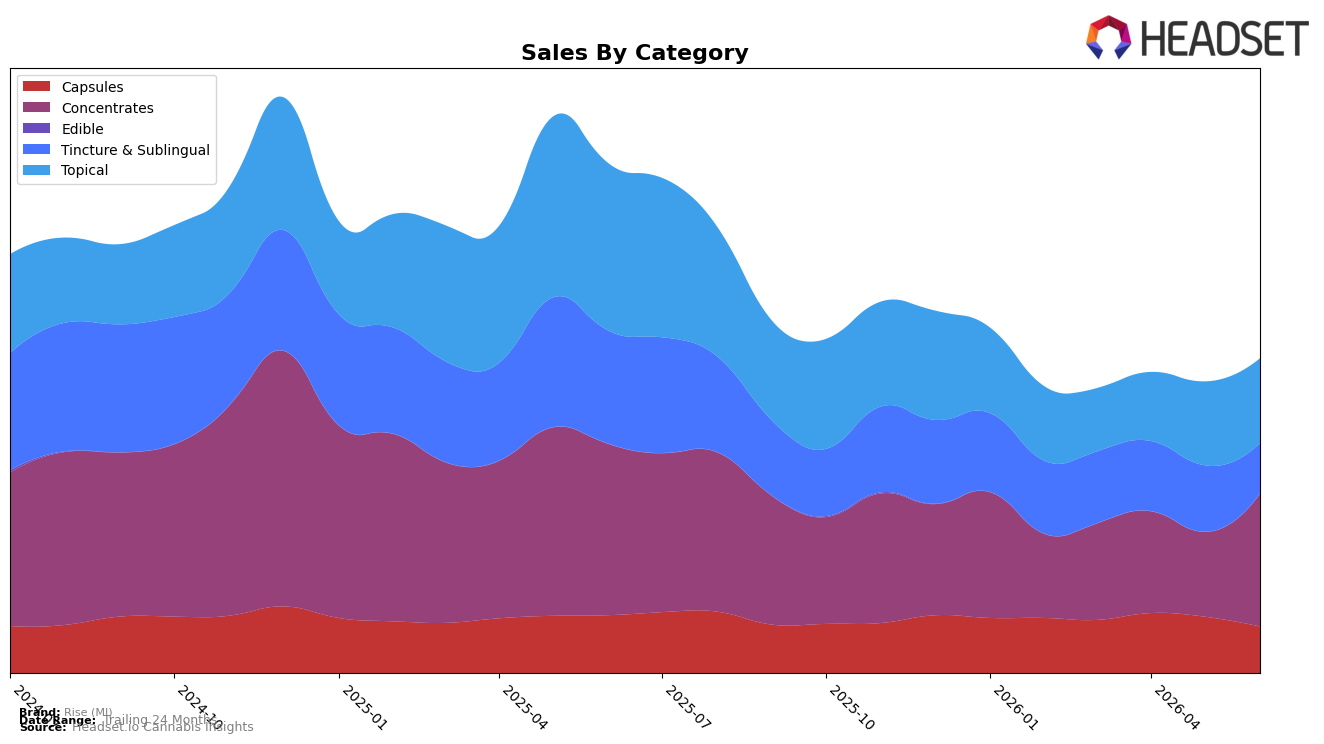
In June 2026, Concentrates carried 42.24% share with month-over-month growth of 56.80% despite a year-over-year decline of 22.57%, while Topical held 26.97% share with a minimal 1.06% MoM increase against a 49.43% YoY drop. Tincture & Sublingual fell 24.02% MoM and 55.46% YoY to 16.03% share, and Capsules contracted 17.53% MoM and 19.64% YoY to 14.75% share. With brand-level sales down 38.37% YoY and average price up 2.14%, the pattern implies demand consolidation into Concentrates as a relative outperformer on a monthly basis, signaling a pivot away from wellness formats toward inhalable potency where quick MoM gains can offset broader YoY erosion.
Given Concentrates now leads mix at 42.24% while Tincture & Sublingual and Capsules together account for 30.78% with simultaneous MoM declines of 24.02% and 17.53%, the near-term positioning centers on maintaining momentum in inhalable value points (average price $15.26 versus $20.29 in Topical). The shift—MoM expansion in Concentrates alongside only 1.06% MoM movement in Topical and double-digit MoM pullbacks in two wellness formats—implies the brand’s relevance skews toward fast-turn, lower-price-per-unit effects rather than higher-price therapeutic use, suggesting resource allocation toward Concentrates to stabilize rank trajectory in Michigan even as YoY softness persists.
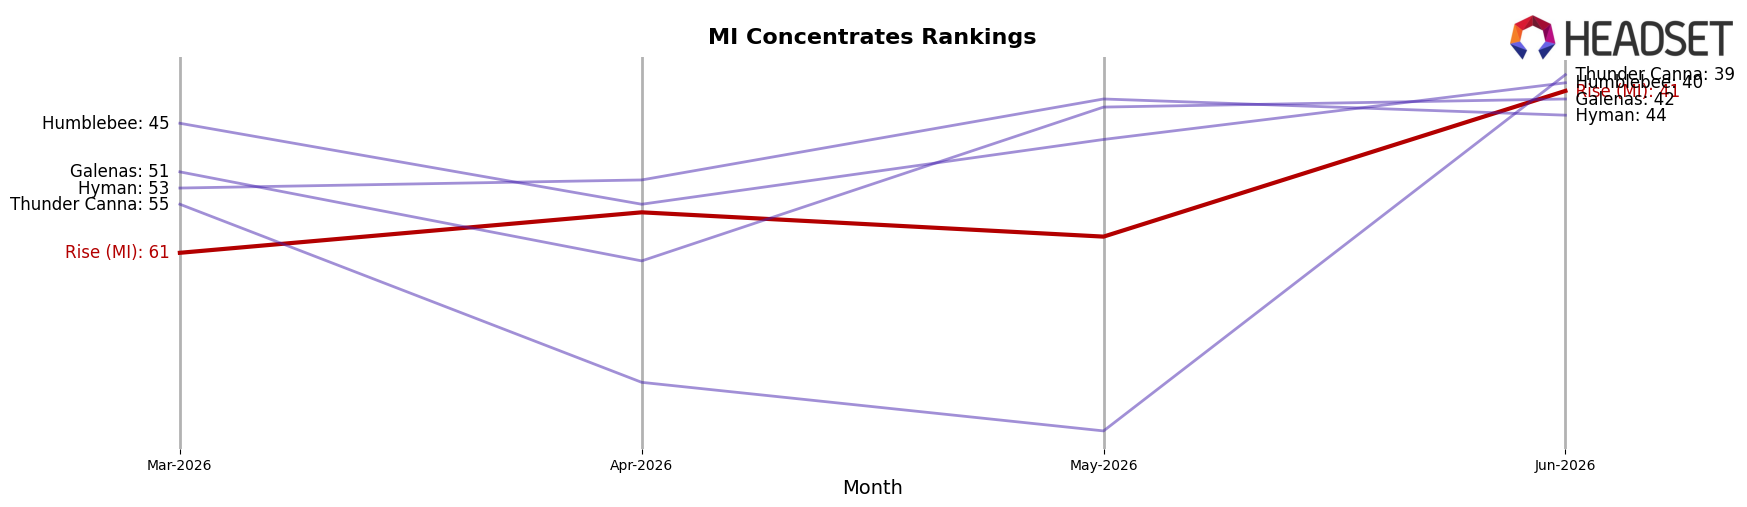
Competitive Landscape
Rise (MI) sits at rank 41 in June 2026 in MI Concentrates, down 14 positions year over year from rank 27 and up 20 positions from March 2026 when it was rank 61; the brand is also 20 spots below its peak rank of 21 from December 2024, indicating a gap from prior highs. In contrast, The Limit holds rank 1 with a 3.9% year-over-year sales increase while Uniq Pressure advanced to rank 4 from rank 133 year over year alongside a 3,338.0% sales surge, a directional shift that outpaces Rise (MI)’s partial rebound. The pattern implies that while Rise (MI) recovered from a three-month trough, the year-over-year slippage and competitor acceleration point to share being ceded to faster risers at the top of the category.
Notable Products
Hybrid RSO Dart (1g) led June 2026 with a 458% month-over-month surge and jumped to rank 1, while RSO Tablets 10-Pack (200mg) fell 35% to rank 9, indicating sharp divergence within the RSO portfolio. Unscented RSO Cream (1000mg THC, 1oz) in Topical rose 3% and held rank 2, as CBD Tincture (1000mg CBD) dropped 11% at rank 10, pointing to demand concentrating away from CBD-heavy formats toward THC-forward RSO. Four of the top ten are Concentrates SKUs, and three are Topical, with the leading item contributing $29,329, implying a pivot toward high-potency RSO delivery and away from lower-dose oral formats.
Top Selling Cannabis Brands
Data for this report comes from real-time sales reporting by participating cannabis retailers via their point-of-sale systems, which are linked up with Headset’s business intelligence software. Headset’s data is very reliable, as it comes digitally direct from our partner retailers. However, the potential does exist for misreporting in the instance of duplicates, incorrectly classified products, inaccurate entry of products into point-of-sale systems, or even simple human error at the point of purchase. Thus, there is a slight margin of error to consider. Brands listed on this page are ranked in the top twenty within the market and product category by total retail sales volume.

