Market Insights Snapshot
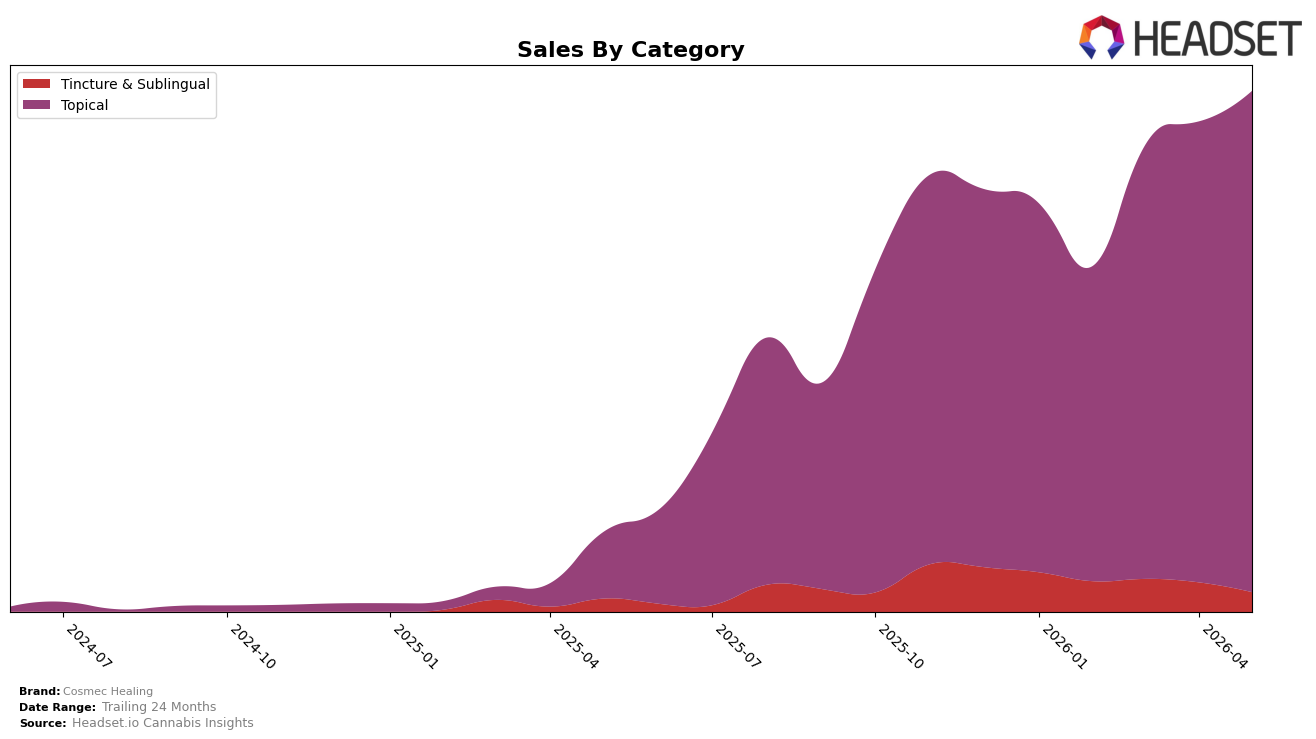
In May 2026, Cosmec Healing concentrated 96.24% of sales in Topical, where category revenue rose 656.49% year over year and 8.77% month over month, while Tincture & Sublingual held 3.76% share with 49.04% year-over-year growth but a 33.42% month-over-month decline; the brand’s average price slipped 0.60% YoY to $47.20 as Topical pricing sat at a $47.64 average versus $38.19 in Tincture & Sublingual. This mix, combined with a Topical rank of 3 in Maryland, implies the May 2026 surge was driven less by price expansion and more by volume acceleration within Topical alongside a tactical deprioritization of Tincture & Sublingual reflected in its MoM contraction.
The shift toward a 96.24% Topical dependency, paired with an 8.77% MoM gain in that category and a simultaneous 33.42% MoM decline in Tincture & Sublingual, increases exposure to Topical category volatility while consolidating visibility at rank 3 in Maryland. Given Topical’s 656.49% YoY surge versus 49.04% in Tincture & Sublingual and a brand-level 555.996% YoY increase, the positioning now tilts toward defending and expanding shelf within Topical to sustain momentum, while the lower Tincture & Sublingual price point at $38.19 creates a gap that can be used selectively for entry-price traffic without diluting the higher-price Topical core.
Competitive Landscape
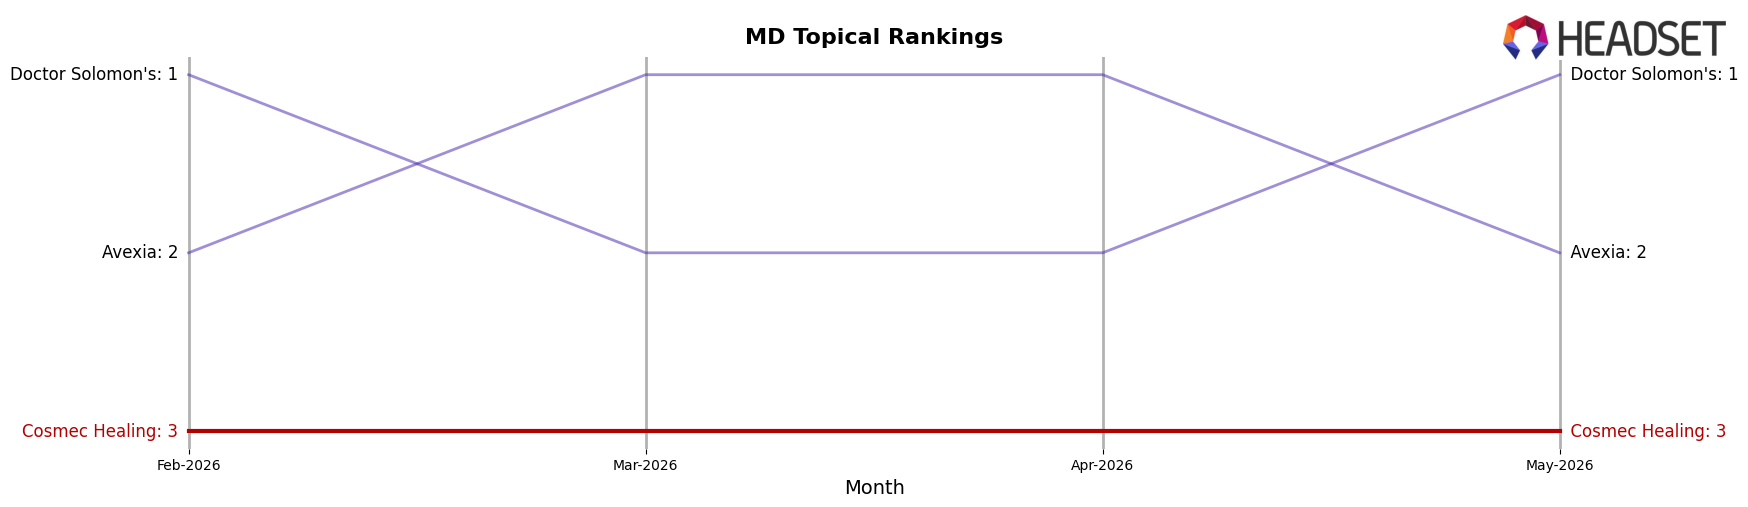
Cosmec Healing is ranked #3 in MD Topical in May 2026, improving 2 positions year over year from #5, while holding flat versus February 2026 at #3; this positioning comes as Doctor Solomon's sits at #1 after rising 1 spot year over year even with a 33.4% sales decline, and Avexia slipped from #1 to #2 alongside a 34.8% sales contraction. With Curio Wellness moving down from #3 to #4 amid a 49.3% drop and Eastern Shore Extracts easing from #4 to #5 with a 25.9% decline, Cosmec Healing’s climb to its peak rank of #3 in May 2026 indicates share consolidation in the top three as competitors above and below lose velocity.
Notable Products
CBD High Dose Full Spectrum Tincture (4200mg CBD) posted a -91.1% month-over-month drop and slid to rank 6, setting the tone for May 2026 as demand pivoted away from ultra-high-dose tinctures. In contrast, CBC/CBD 1:2 Relief Tincture (600mg CBC, 1200mg CBD, 30ml) jumped 87.7% MoM to rank 2 while the flagship CBD/CBN/THC 4:2:1 Recovery Salve Balm (1000mg CBD, 500mg CBN, 250mg THC) in Topical held rank 1 with +8.8% MoM, indicating mixed momentum within the top tier. Four of the top ten are Tincture & Sublingual SKUs clustered at ranks 2 through 6 with swings from +87.7% to -91.1%, while Topical holds two of the top three with +8.8% and +7.7%, implying shoppers are consolidating around functional topicals and a single value-forward tincture rather than high-dose formats.
Top Selling Cannabis Brands
Data for this report comes from real-time sales reporting by participating cannabis retailers via their point-of-sale systems, which are linked up with Headset’s business intelligence software. Headset’s data is very reliable, as it comes digitally direct from our partner retailers. However, the potential does exist for misreporting in the instance of duplicates, incorrectly classified products, inaccurate entry of products into point-of-sale systems, or even simple human error at the point of purchase. Thus, there is a slight margin of error to consider. Brands listed on this page are ranked in the top twenty within the market and product category by total retail sales volume.

