Jun-2026
Sales
Trend
6-Month
Product Count
SKUs
Avg Price
YoY Sales Change
YoY Price Change
Market Insights Snapshot
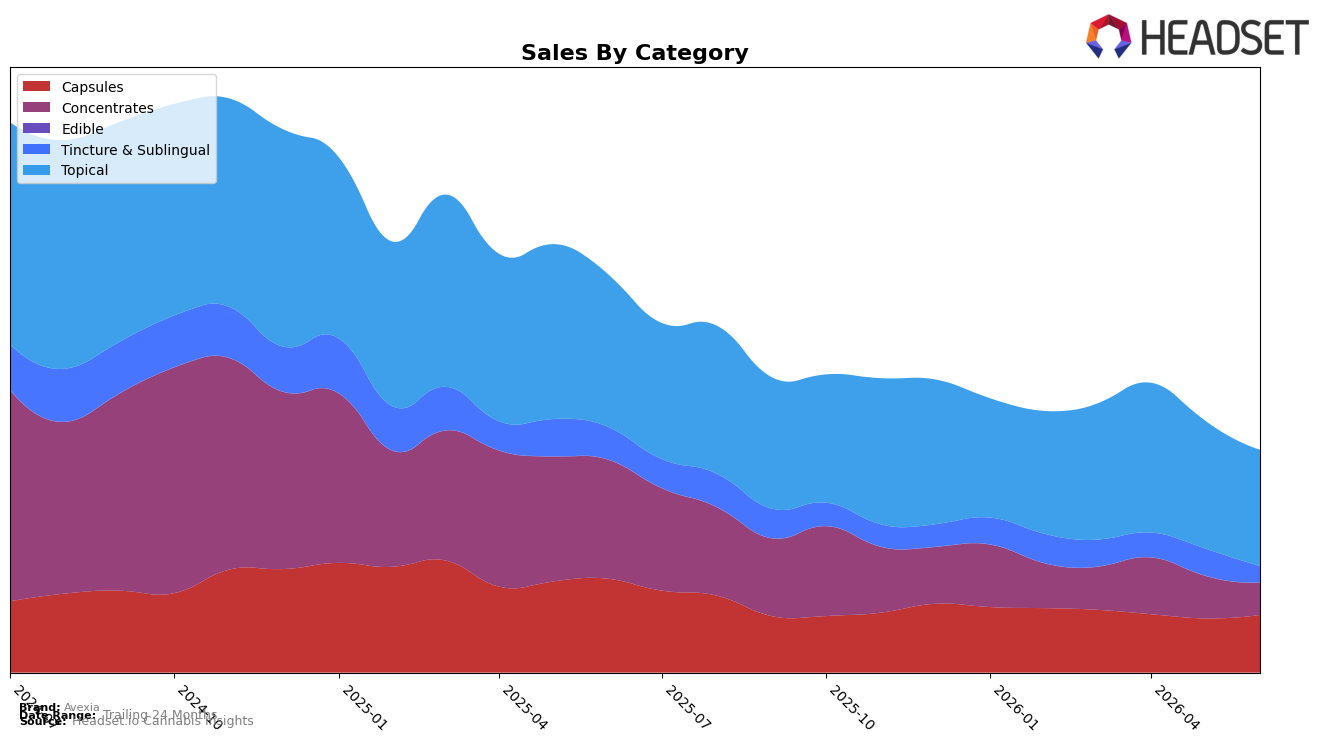
Avexia’s category mix in June 2026 is concentrated in Topical at 52.31% share with a year-over-year decline of 23.90% and a month-over-month dip of 9.24%, while Capsules hold 25.93% share with a 38.60% year-over-year drop but a 6.45% month-over-month gain. Concentrates account for 14.51% share with a 72.91% year-over-year decrease and a 24.27% month-over-month decline, and Tincture & Sublingual sits at 7.26% share with a 50.25% year-over-year fall and a 40.30% month-over-month slide. Despite an overall brand sales contraction of 44.16% year over year and a 7.01% year-over-year reduction in average price, Avexia’s mix shift shows Capsules stabilizing month over month while Topical softens, implying the brand’s near-term volume is leaning on Capsules’ incremental recovery even as premium-priced Topical remains the anchor.
With Topical ranked 1 in Illinois and holding a 52.31% mix at a category-average price of $32.48, the 9.24% month-over-month decline alongside a 6.45% month-over-month uptick in lower-priced Capsules at $21.42 indicates a trade-down dynamic that reallocates share toward value formats without fully offsetting the 23.90% Topical year-over-year slide. Concurrent 24.27% and 40.30% month-over-month contractions in Concentrates and Tincture & Sublingual compress the long tail, concentrating the portfolio into two price tiers; this bifurcation suggests Avexia’s positioning is skewing toward a barbell of premium Topical and value Capsules, which can preserve rank in Topical but will likely keep total revenue under pressure unless Topical recovers or Capsules’ 25.93% share expands materially.
Competitive Landscape
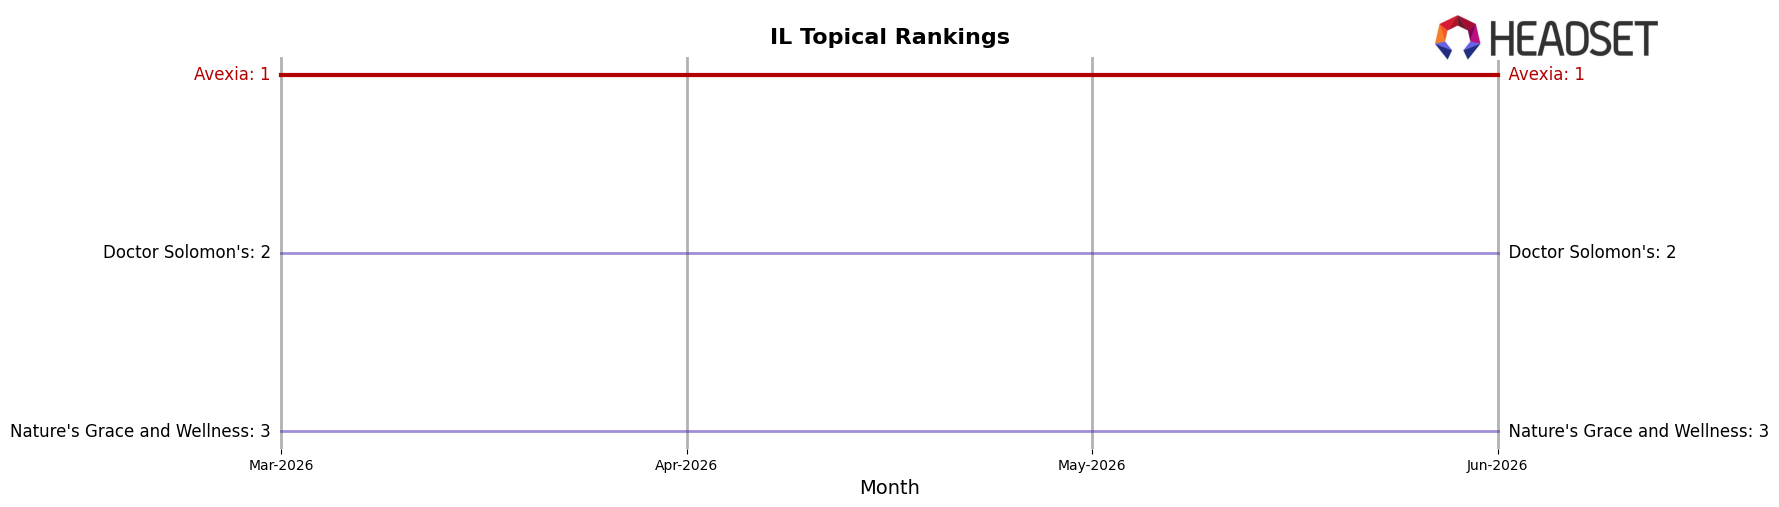
Avexia sits at #1 in IL Topical in June 2026 with no YoY rank change from #1, and no 3-month movement from #1, while Doctor Solomon's holds #2 with a -26.9% YoY sales change and Nature's Grace and Wellness remains #3 with a -35.4% YoY sales change; in contrast, Alchemy (Ieso) stays at #4 despite a +55.9% YoY sales increase and Alluris Wellness stays at #5 with a -8.8% YoY sales change. The flat rank trajectory at #1 year-over-year and quarter-over-quarter, paired with competitors either declining at -26.9% and -35.4% or growing without rank gains at +55.9%, implies Avexia’s leadership is anchored more in category share stability than in absolute sales expansion, signaling durable positional advantage through June 2026.
Notable Products
CBD/THC 1:1 Harmony Pain Relief Lotion (100mg CBD, 100mg THC, 2oz) fell 16.1% month over month to rank 5 in June 2026, while the category leader CBD/THC 1:1 Harmony Pain Relief Balm (100mg CBD, 100mg THC, 2oz) slipped 2.3% but held rank 1; this split suggests Topical demand is consolidating around a single hero SKU rather than lifting the whole line. At the same time, CBN/CBD/THC 1:1:1 Comfort Tablets 40-Pack (100mg CBN, 100mg CBD, 100mg THC) surged 46.1% and climbed to rank 3, and CBD/THC 1:1 Harmony Micro-Dosed Tablets 40-Pack (100mg CBD,100mg THC) rose 19.3% to rank 4, so four of the top ten are Capsules, indicating ingestibles are gaining share even as the top Topical concentrates value at $230,110. The pattern implies Avexia’s mix is tilting from topical breadth toward a single flagship in Topical and a growing stack of Capsules that can scale volume efficiently.
Top Selling Cannabis Brands
Data for this report comes from real-time sales reporting by participating cannabis retailers via their point-of-sale systems, which are linked up with Headset’s business intelligence software. Headset’s data is very reliable, as it comes digitally direct from our partner retailers. However, the potential does exist for misreporting in the instance of duplicates, incorrectly classified products, inaccurate entry of products into point-of-sale systems, or even simple human error at the point of purchase. Thus, there is a slight margin of error to consider. Brands listed on this page are ranked in the top twenty within the market and product category by total retail sales volume.

