Jun-2026
Sales
Trend
6-Month
Product Count
SKUs
Avg Price
YoY Sales Change
YoY Price Change
Market Insights Snapshot
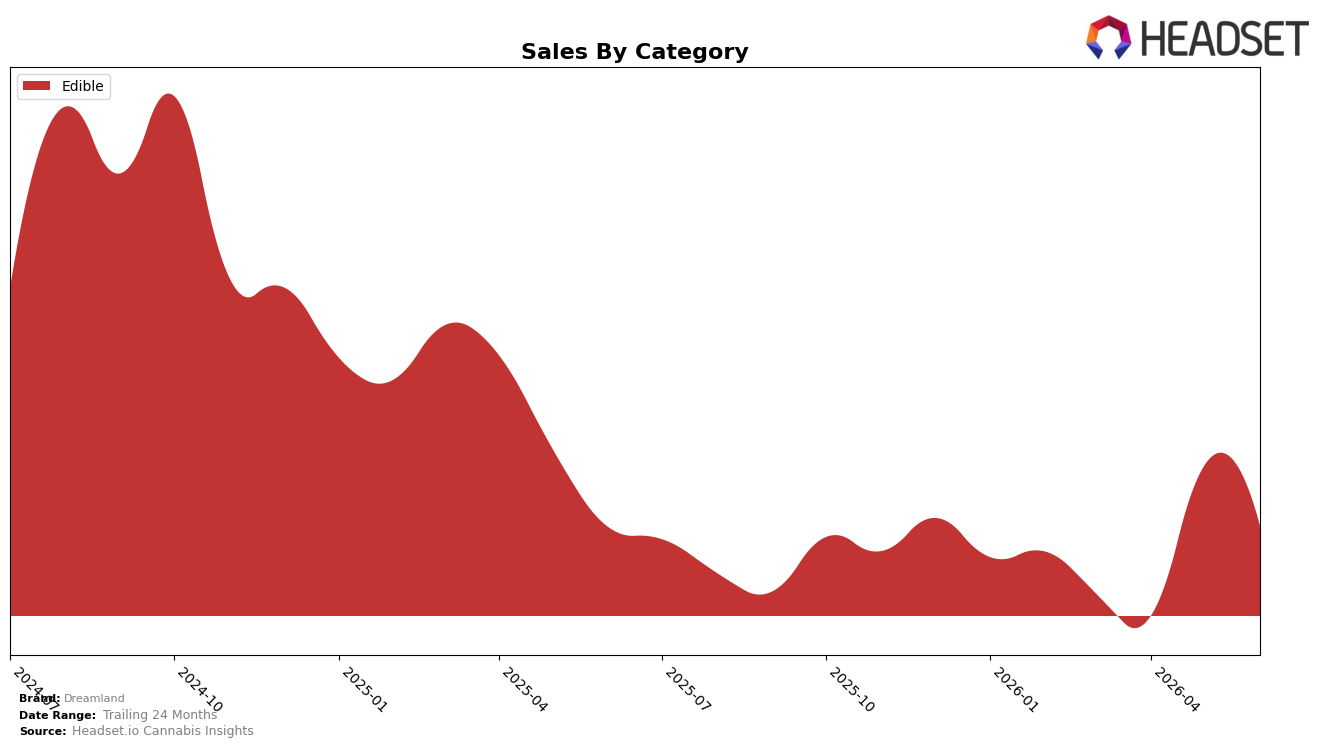
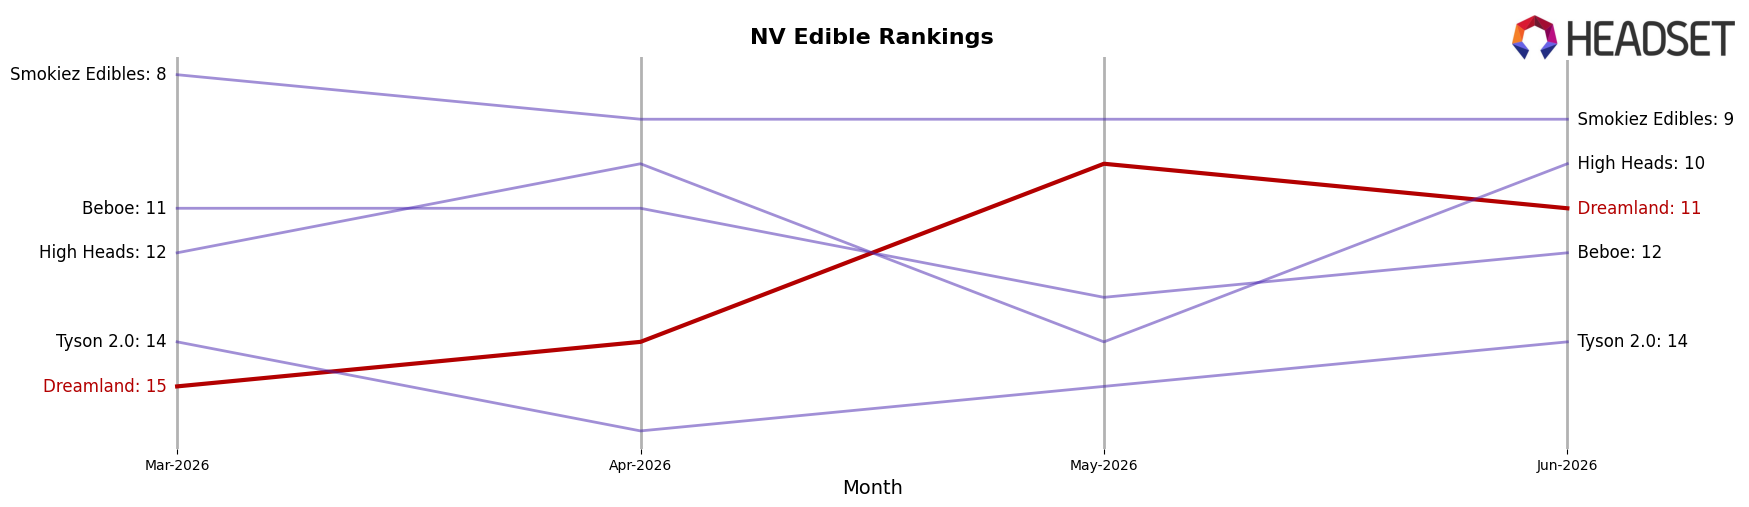
Dreamland is fully concentrated in Edible, with a 100.0% category share in June 2026 and an average price of $17.62; year over year, Edible sales grew 29.0% while month over month declined 11.4%. Within Nevada Edible rankings, Dreamland sat at rank 11 in June 2026, implying recovery versus June 2025 alongside short-term pullback from May 2026; the combination of a 15.3% YoY price increase and a 29.0% YoY sales lift signals mix depth within Edible rather than cross-category expansion.
The concentration at 100.0% Edible coupled with a rank of 11 in Nevada and an 11.4% MoM sales dip suggests sensitivity to intra-category pricing and promotional cadence, not diversification effects; with a 15.3% YoY price increase, the 29.0% YoY sales gain implies elasticity headroom in Edible, whereas the month-to-month contraction indicates demand volatility around price points. This pattern implies that improving rank into the top 10 in Nevada Edible likely depends more on tactical price and assortment tuning within Edible than on entering adjacent categories, given that all growth and variability are occurring within a single-category footprint.
Competitive Landscape
Dreamland sits at rank #11 in NV Edible in June 2026, a 2-position improvement from #13 year over year and a 4-position climb from #15 in March 2026, while still trailing its peak at #7 from October 2024; by contrast, Kanha / Sunderstorm jumped from #9 to #3 with a 191.18% YoY sales change and Wyld held #1 with a -1.87% YoY sales change, indicating that Dreamland’s steady rank gains are occurring amid both aggressive upward movement by a challenger and stability at the top, which implies the brand’s trajectory is incremental rather than breakout unless it accelerates share capture.
Notable Products
Banana Milk Chocolate Bar 10-Pack (100mg) posted the steepest decline at -30.3% and sits at rank 6, while Peanut Butter Milk Chocolate Cubes 4-Pack (40mg) fell -26.4% but still holds rank 1; together with Mystical Milk Chocolate Bar (100mg) at -16.2% and rank 3, the downside concentrates among prior leaders. Meanwhile, Cinnamon Sugar Bits Cereal Milk White Chocolate Bar 10-Pack (100mg) rose 11.1% to rank 5 and Fruit Flavored Bits Cereal Milk White Chocolate Bar (100 mg) gained 3.0% at rank 4, yet Peppermint Dark Chocolate Bar 10-Pack (100mg) slipped -6.1% at rank 2, signaling mixed traction within the top five. Eight of the top ten are Edible chocolate bars, and the only non-bar leader at rank 1 generated $11,861, implying the portfolio remains concentrated in bars even as a cube format anchors headline visibility. The pattern implies June 2026 marked a defensive shift toward breadth within bars rather than reliance on a few hero SKUs, nudging Dreamland to stabilize core chocolate lines while reassessing format diversification.
Top Selling Cannabis Brands
Data for this report comes from real-time sales reporting by participating cannabis retailers via their point-of-sale systems, which are linked up with Headset’s business intelligence software. Headset’s data is very reliable, as it comes digitally direct from our partner retailers. However, the potential does exist for misreporting in the instance of duplicates, incorrectly classified products, inaccurate entry of products into point-of-sale systems, or even simple human error at the point of purchase. Thus, there is a slight margin of error to consider. Brands listed on this page are ranked in the top twenty within the market and product category by total retail sales volume.

