Jun-2026
Sales
Trend
6-Month
Product Count
SKUs
Avg Price
YoY Sales Change
YoY Price Change
Market Insights Snapshot
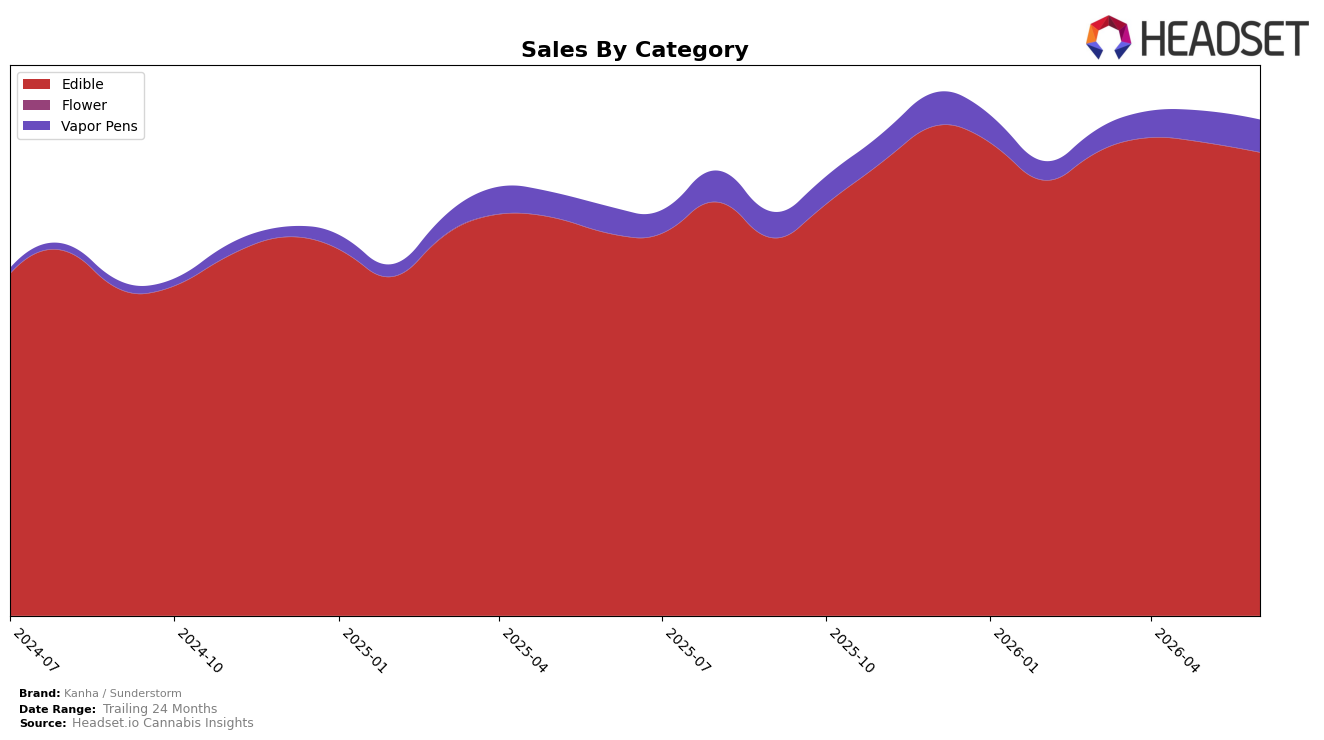
In June 2026, Edible accounted for 93.50% share with year-over-year growth of 21.18% but month-over-month decline of 2.08%, while Vapor Pens held 6.50% share with year-over-year growth of 22.25% and month-over-month increase of 3.75%. The brand’s overall sales grew 21.25% year over year alongside a 0.88% increase in average price, and Edible pricing at 16.16 versus Vapor Pens at 36.06 indicates a mix weighted toward lower price points. With Edible softening month over month as Vapor Pens expands, the pattern implies a slight pivot toward higher-priced formats that can cushion MoM variability while preserving the Edible-led scale.
Holding rank 1 in Edible in Massachusetts while Edible share contracted 2.08% month over month and Vapor Pens expanded 3.75% month over month suggests the brand can lean on leadership to defend Edible while selectively accelerating into Vapor Pens. Given 93.50% of volume concentrated in Edible and an overall 21.25% year-over-year lift against just a 0.88% price increase, the shift implies room to trade up mix without eroding accessibility, positioning Kanha / Sunderstorm to balance category breadth with its Edible anchor.
Competitive Landscape
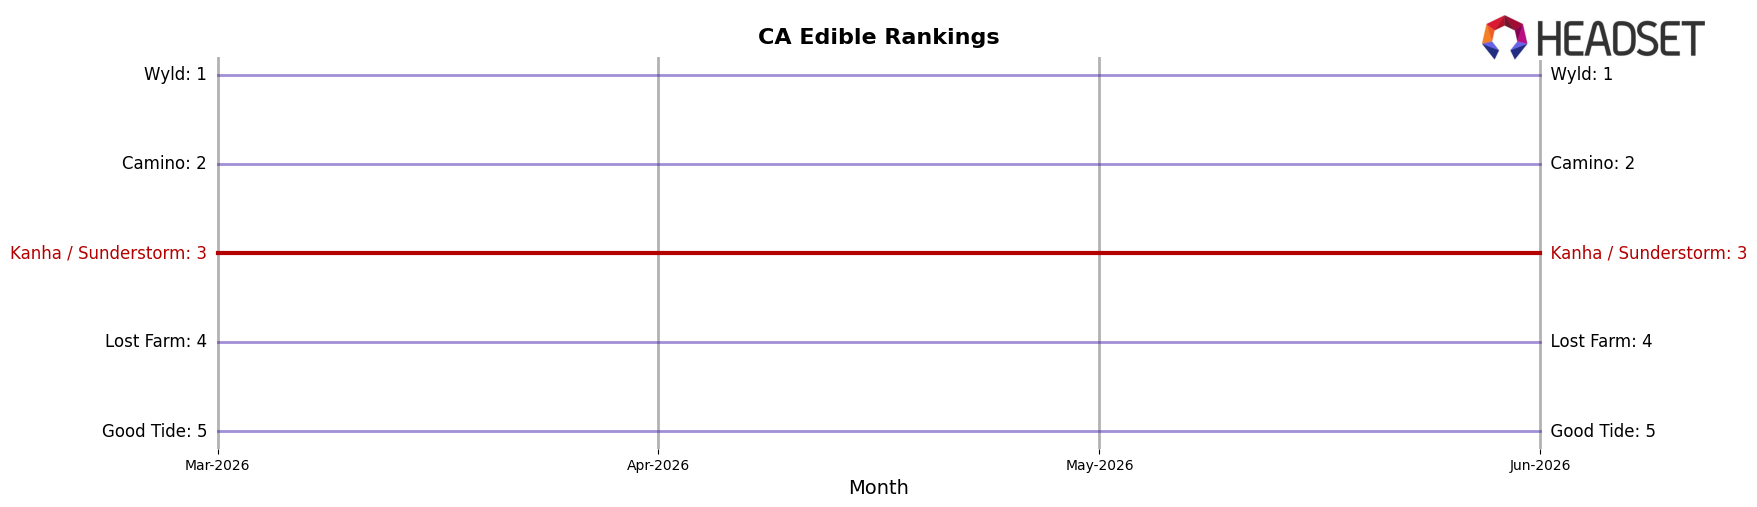
Kanha / Sunderstorm holds rank #3 in California Edible for June 2026, unchanged from rank #3 in June 2025, with a flat year-over-year rank trajectory while category leaders moved in opposite sales directions: Wyld stayed at #1 despite a -1.9% sales change year over year, whereas Camino held #2 with a +12.9% sales lift; further, Lost Farm remained #4 with +7.2% and Good Tide stayed #5 with +28.5%, indicating that Kanha / Sunderstorm’s steadiness at #3 across March 2026 to June 2026 did not convert competitor volatility into upward rank mobility. The pattern implies Kanha / Sunderstorm is defending share rather than converting growth pockets above and below it, as evidenced by no climb from #3 despite a -1.9% softening at #1 and double-digit growth of +12.9% at #2.
Notable Products
CBN/CBD/THC 3:1:2 Sleep Marionberry Plum Gummies 10-Pack (150mg CBN, 50mg CBD, 100mg THC) held rank 1 despite a -2.5% month-over-month dip, while Sativa Sour Island Breeze Solventless Rosin Gummies 10-Pack (100mg) slid to rank 3 with a -4.2% change. Blueberry Lemon Drop Rosin Sour Gummy Belts 4-Pack (100mg) in rank 2 posted a +1.5% uptick, contrasting with Strawberry Lemonade Solventless Rosin Gummies Belts 4-Pack (100mg) at rank 6 down -7.0%. With all ten top SKUs sitting in Edible and four in the solventless rosin gummy family across the top ten, the pattern implies concentration in functional and rosin-led formats over breadth expansion, even as incremental rank resilience offsets modest June softness.
Top Selling Cannabis Brands
Data for this report comes from real-time sales reporting by participating cannabis retailers via their point-of-sale systems, which are linked up with Headset’s business intelligence software. Headset’s data is very reliable, as it comes digitally direct from our partner retailers. However, the potential does exist for misreporting in the instance of duplicates, incorrectly classified products, inaccurate entry of products into point-of-sale systems, or even simple human error at the point of purchase. Thus, there is a slight margin of error to consider. Brands listed on this page are ranked in the top twenty within the market and product category by total retail sales volume.

