Jun-2026
Sales
Trend
6-Month
Product Count
SKUs
Avg Price
YoY Sales Change
YoY Price Change
Market Insights Snapshot
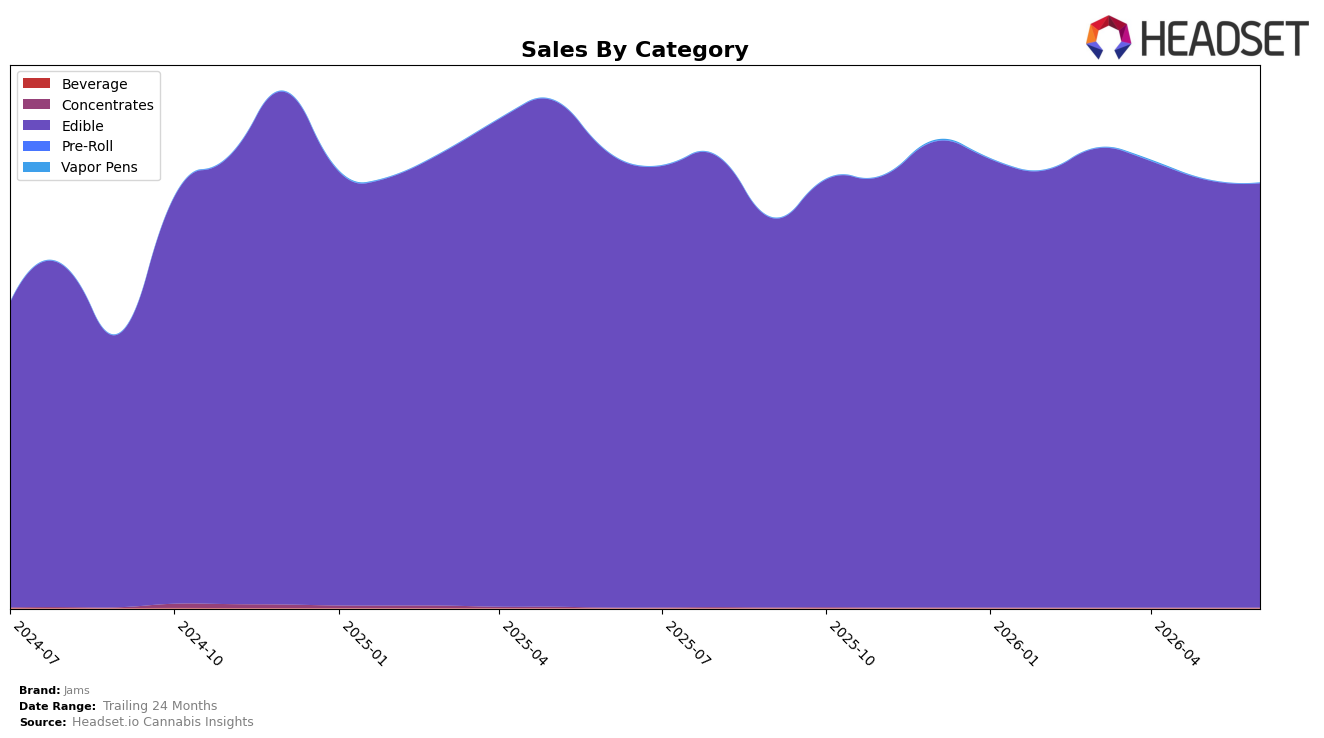
In June 2026, Jams operated as a single-category brand with Edible accounting for 100.0% of sales, pairing a year-over-year sales change of -6.8% with a month-over-month decline of -0.9%. Average price fell -16.7% versus June 2025 to $13.08, while overall brand sales were down -6.8% YoY; this mix-price pairing indicates unit volumes likely rose mid-teens even as revenue contracted. With Edible concentration at 100.0% and Jams holding rank 5 in Edible within Maryland, the setup implies the brand traded price for unit velocity but lacked offsetting category diversification to cushion the -6.8% revenue pullback.
The combination of a -16.7% average price shift and a smaller -6.8% sales decline suggests a value-led positioning in Edibles, where gaining or defending shelf presence depends more on unit throughput than ticket size; being ranked 5 in Maryland points to scale adequate for retailer acceptance but exposed to pricing swings. Given a 49.0% sales lift over 24 months alongside a June 2026 month-over-month dip of -0.9%, the trajectory implies Jams is past its initial expansion curve and now competing on repeat rate and pack-size architecture; maintaining a top-5 foothold requires stabilizing price elasticities so that future percentage moves in price translate more efficiently to share preservation rather than short-term unit spikes.
Competitive Landscape
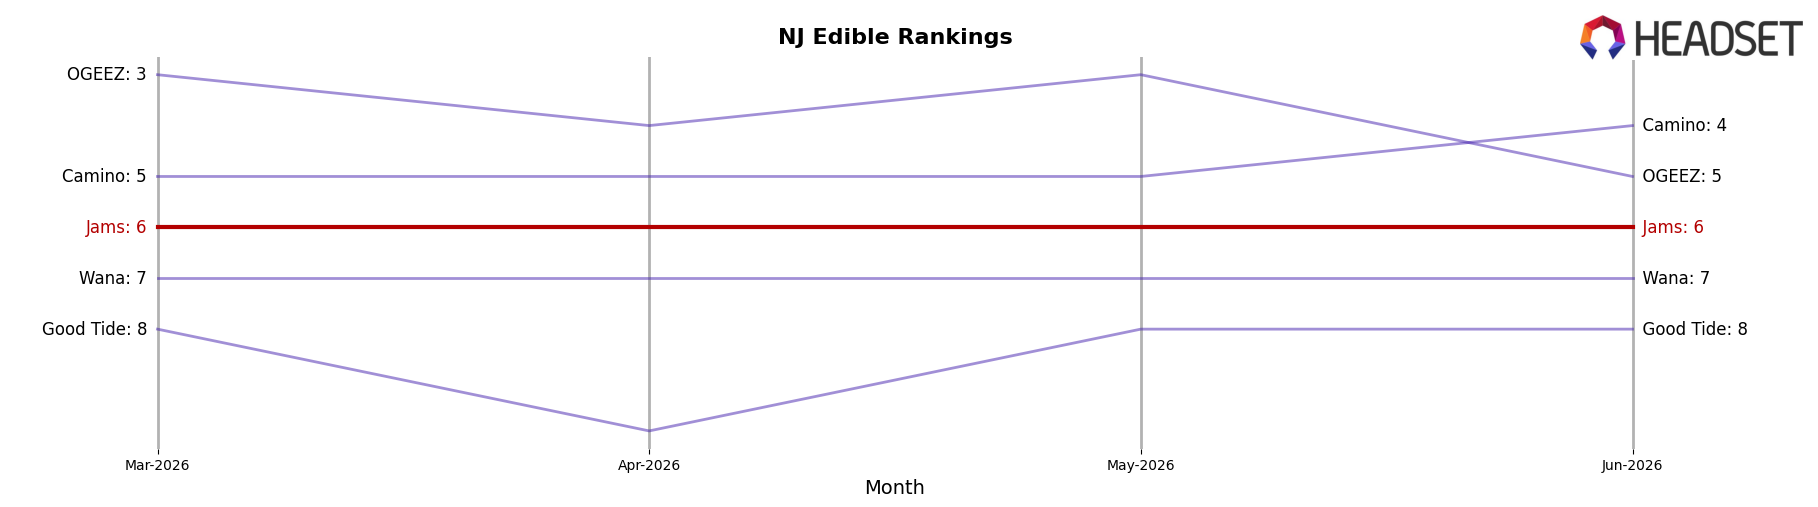
Jams ranks #6 in NJ Edible for June 2026, unchanged YoY at #6, and has stayed flat versus three months ago at #6, while its peak position of #4 in November 2025 indicates prior headroom; meanwhile, Gron / Grön held #1 YoY to #1 despite a -22.1% sales YoY change, and Wyld climbed from #4 to #2 on +28.1% sales YoY, outpacing peers as Select slipped from #2 to #3 with -25.9% sales YoY. The combination of Jams’ static #6 rank and competitors’ upward moves—such as OGEEZ rising from #9 to #5 on +44.6% sales YoY—implies that Jams’ current trajectory is defensive retention rather than recovery toward its November 2025 peak, making share preservation the near-term pattern.
Notable Products
Classic - Sativa Ruby Red Grapefruit Jellies 10-Pack (100mg) set the tone in June 2026 with a 923% month-over-month surge to rank 4, dwarfing the 182% jump that lifted Sativa Sour Strawberry Lemonade Fast Acting Jellies 20-Pack (100mg) to rank 3. Mixed Berry Gummies 10-Pack (100mg) climbed 109% to rank 2 while THC/CBD/CBN 2:1:1 Lullaberry Remix Jellies 10-Pack (100mg THC, 50mg CBD, 50mg CBN) advanced 50% to hold rank 1, and five of the top ten are Fast Acting Jellies SKUs, concentrating momentum in speed-led formats. In contrast, Hybrid Peach Jellies 10-Pack (100mg) fell 15% to rank 6 while Sour Green Apple Fast Acting Jellies 20-Pack (100mg) slipped 99% to rank 5 from a higher base, indicating selective cannibalization within flavor lanes despite category-wide lifts. The pattern points to a portfolio tilting toward fast-acting and functional remix lines, implying Jams is consolidating share around rapid-onset and multi-cannabinoid propositions rather than legacy fruit SKUs.
Top Selling Cannabis Brands
Data for this report comes from real-time sales reporting by participating cannabis retailers via their point-of-sale systems, which are linked up with Headset’s business intelligence software. Headset’s data is very reliable, as it comes digitally direct from our partner retailers. However, the potential does exist for misreporting in the instance of duplicates, incorrectly classified products, inaccurate entry of products into point-of-sale systems, or even simple human error at the point of purchase. Thus, there is a slight margin of error to consider. Brands listed on this page are ranked in the top twenty within the market and product category by total retail sales volume.

