.svg)
Aug-2026
Sales
Trend
6-Month
Product Count
SKUs
Avg Price
YoY Sales Change
YoY Price Change


Market Insights Snapshot
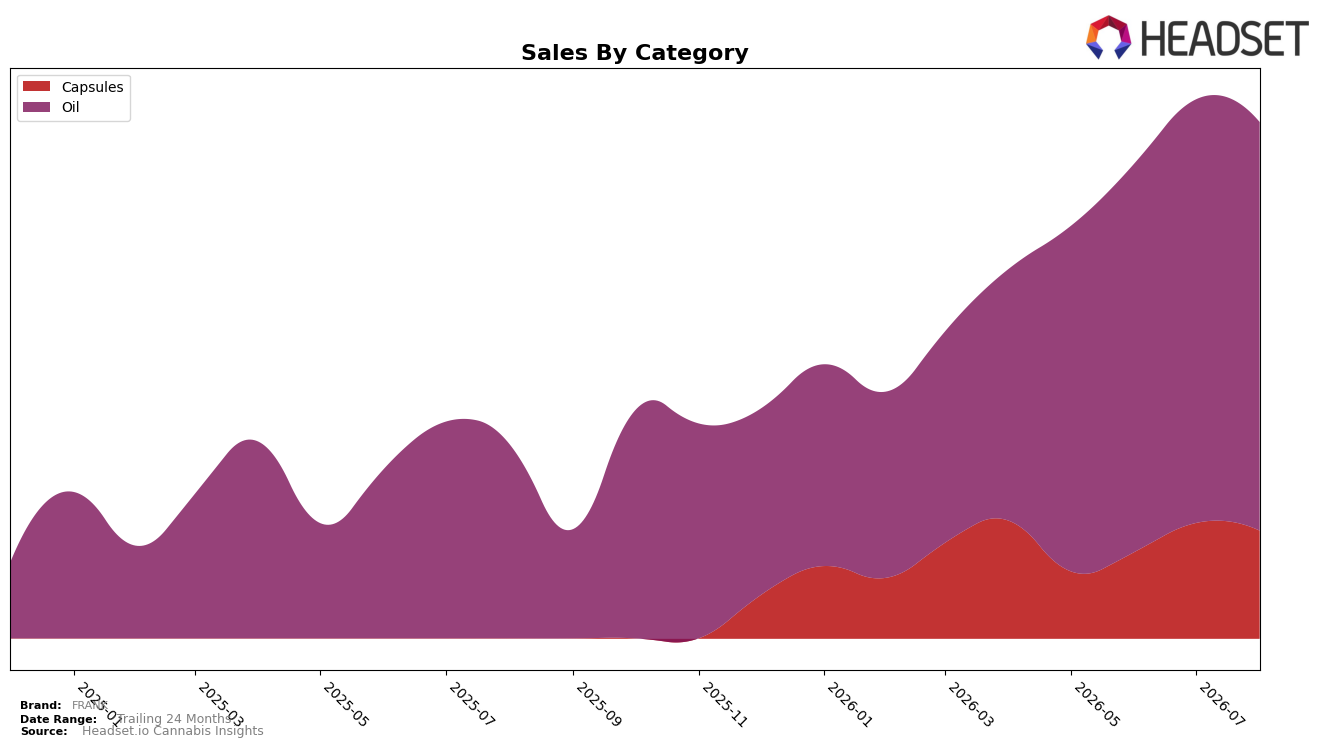
In August 2026, FRANK concentrated 79.11% of sales in Oil with a 110.50% year-over-year lift while posting a 3.56% month-over-month dip, and held 20.89% in Capsules with a 6.61% month-over-month decline alongside no year-over-year baseline. Overall brand sales advanced 166.08% year over year even as average price fell 10.22%, and Oil ranked 6 in Alberta, indicating volume-led gains outweighing price compression within a mix tilted toward a single category.
The mix shift signals a positioning anchored in Oil where price at $44.94 sits above the brand’s $40.91 average and Capsules at $30.54 under-index on price, implying margin reliance on Oil despite its 3.56% month-over-month softness. With 79.11% share concentrated in Oil and a 6 rank in Alberta Oil, the brand trades depth for breadth; sustaining the 166.08% year-over-year sales surge likely depends on stabilizing monthly Oil trends while using lower-priced Capsules’ 20.89% share to cushion further 10.22% average price compression.
Competitive Landscape
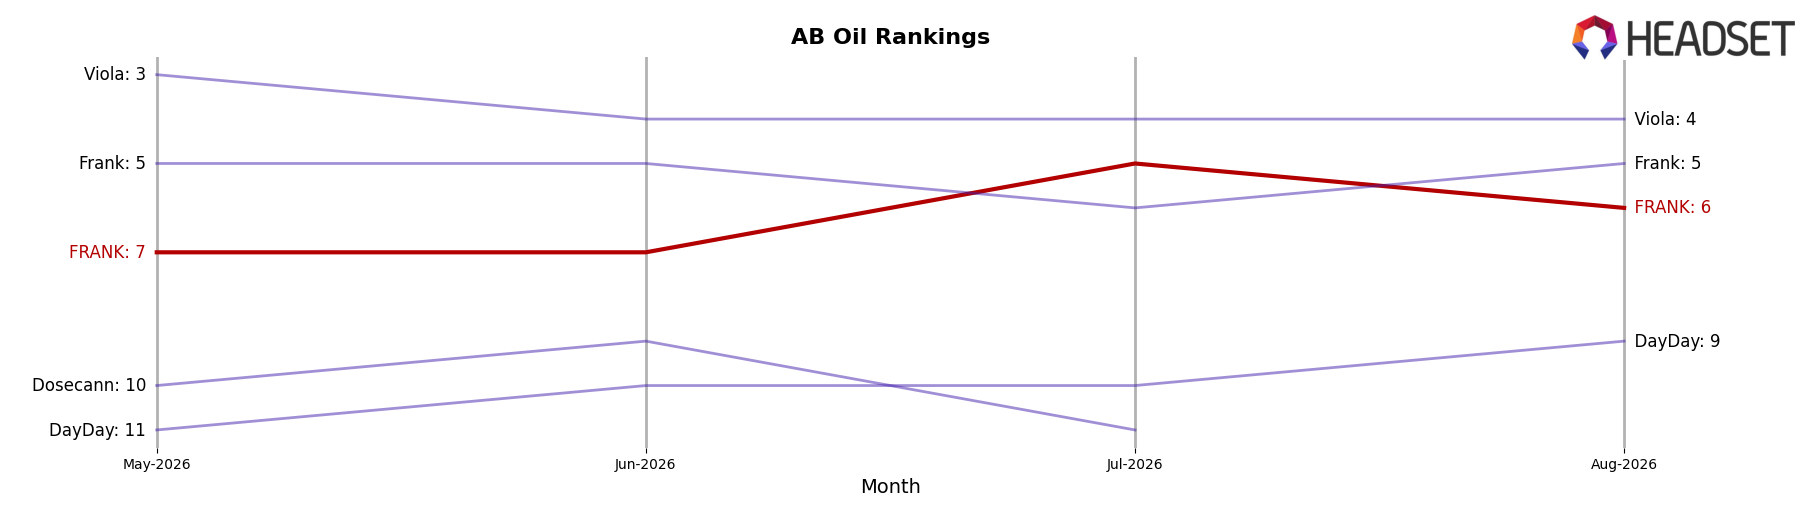
FRANK sits at #6 in August 2026, improving 3 ranks from #9 year over year, and edging up 1 position from #7 three months prior; however, it remains 1 spot below its July 2026 peak of #5. Competitive movement is uneven: Tweed is currently #2 after rising from #3 with sales up 10.7% year over year, while Viola slid to #4 from #2 with a 29.3% YoY sales decline; by contrast, category leader MediPharm Labs holds #1 year over year and currently despite a 40.2% YoY sales drop, and NightNight climbed from #7 to #3 with 57.2% YoY growth. The pattern implies FRANK’s rank gains are more about competitor volatility than acceleration, so sustaining a top-5 position will hinge on converting the 1-rank quarter-on-quarter improvement into consistent share capture rather than relying on others’ declines.
Notable Products
CBD Ultra 250 Oil Drops (30ml) slipped 3.6% month over month to hold rank 1, while CBD Ultra Capsules 30-Pack (3000mg CBD) fell 6.6% and remained at rank 2. With both top SKUs in Oil and Capsules posting negative MoM and the leader maintaining the number 1 slot against a number 2 that is nearly three times smaller by sales at $20,267, the pattern implies FRANK is leaning on a concentrated core where share defense matters more than short-term expansion. The two-product top tier spanning Oil and Capsules, each declining between 3% and 7%, suggests August 2026 prioritized price or inventory stability over promotional velocity. This mix points to a commercial direction focused on sustaining category leadership while preparing for broader SKU activation rather than chasing immediate volume spikes.
Top Selling Cannabis Brands






Data for this report comes from real-time sales reporting by participating cannabis retailers via their point-of-sale systems, which are linked up with Headset’s business intelligence software. Headset’s data is very reliable, as it comes digitally direct from our partner retailers. However, the potential does exist for misreporting in the instance of duplicates, incorrectly classified products, inaccurate entry of products into point-of-sale systems, or even simple human error at the point of purchase. Thus, there is a slight margin of error to consider. Brands listed on this page are ranked in the top twenty within the market and product category by total retail sales volume.

